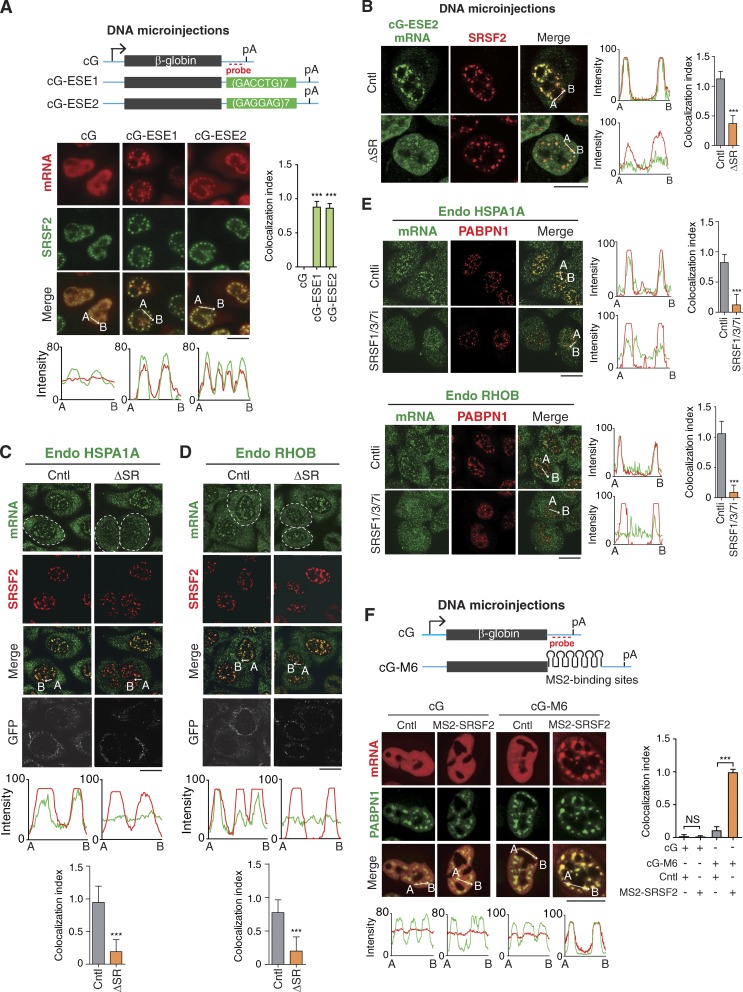
Figure 6.
ESEs and SR proteins function in speckle association of intronless mRNAs. (A) Top: Schematic of cG constructs. Sequence from the vector is indicated as the cyan line, and the regions of the cG and ESEs are indicated as gray and green bars, respectively. The positions of the promoter, polyA (pA) signal, and FISH probe are marked. Bottom: Fluorescence microscopic images show the distribution of cG, cG-ESE1, and cG-ESE2 mRNAs transcribed from microinjected DNA constructs and NSs. α-Amanitin (4 µg/ml) was added 20 min after microinjection. FISH with the 3′ probe and IF with the SRSF2 antibody were performed at 2 h after the addition of α-amanitin. The colocalization index is shown on the right. The red and green lines in the graphs demonstrate the mRNA and SRSF2 IF signal intensities, respectively. (B) Confocal fluorescence microscopic images to show the distribution of the cG-ESE2 mRNA coexpressed with the Cntl or ΔSR RNAs and NSs. α-Amanitin (4 µg/ml) was added 20 min after coinjection of the cG-ESE2 construct (30 ng/µl), together with the Cntl or the ΔSR construct (100 ng/µl). FISH with the β-globin probe and IF with the SRSF2 antibody were performed at 2 h after the addition of α-amanitin. The colocalization index is shown on the right. The green and red lines in the graphs demonstrate the mRNA and SRSF2 IF signal intensities, respectively. The colocalization index is shown on the right. (C and D) Confocal fluorescence microscopic images show the distribution of the endogenous HSPA1A (C) and RHOB (D) mRNAs and NSs in cells expressing the Cntl or ΔSR RNA. To allow the release of mRNAs that had entered NSs before SR depletion, 8 h after microinjection of the Cntl or ΔSR construct, FISH with transcript-specific probes, SRSF2 IF, and GFP IF indicating the microinjected cells (circles) were performed. Note that to avoid signal leakage between channels, only a tiny amount of GFP construct was injected. The green and red lines in the graphs demonstrate the mRNA and SRSF2 IF signal intensities, respectively. The colocalization index is shown at the bottom. (E) Confocal fluorescence microscopic images show the distribution of the endogenous HSPA1A and RHOB mRNAs and NSs in cells treated with Cntl or SRSF1/3/7 siRNAs for 72 h. The green and red lines in the graphs demonstrate the mRNA and PABPN1 IF signal intensities, respectively. The colocalization index is shown on the right. (F) Top: Schematic of cG and cG-M6 constructs. Sequences from the vector and cG are indicated as cyan line and gray bars, respectively. The positions of the promoter, polyA (pA) signal, and FISH probe are marked. Bottom: Confocal fluorescence microscopic images show the distribution of cG and cG-M6 transcribed from microinjected DNA constructs and NSs in cells coexpressing GFP-MS2 (Cntl) or MS2-SRSF2. α-Amanitin (4 µg/ml) was added 20 min after microinjection. FISH with the 3′ probe and IF with the PABPN1 antibody were performed at 2 h after the addition of α-amanitin. The colocalization index is shown on the right. The red and green lines in the graphs demonstrate the mRNA and PABPN1 IF signal intensities, respectively. Data represent the mean ± SD from three independent experiments; n = 10. Bars, 20 µm. Statistical analysis was performed using an unpaired t test. ***, P < 0.01.

