Figure 7.
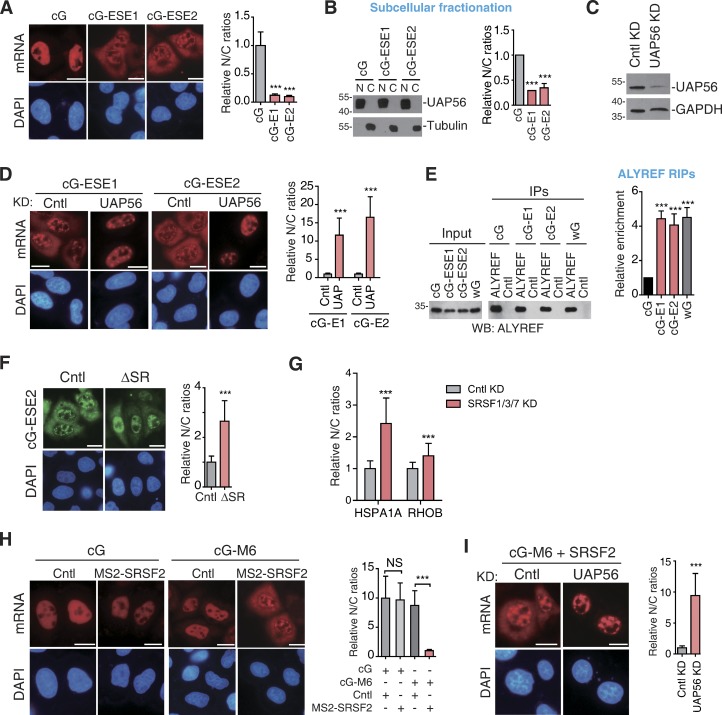
Speckle association promotes TREX recruitment and TREX-dependent intronless mRNA export. (A) Fluorescence microscopic images show the distribution of the cG, cG-ESE1, and cG-ESE2 mRNA derived from equal amounts of microinjected cG, cG-ESE1, and cG-ESE2 constructs. α-Amanitin (4 µg/ml) was added at 20 min after injection, and 4 h later, FISH with the 3′ vector probe was performed. DAPI staining marks the nucleus. Relative N/C ratios are shown on the right. Data represent the mean ± SD from three independent experiments; n = 30. (B) Equal amounts of cG, cG-ESE1, and cG-ESE2 constructs were transfected into HeLa cells. 24 h later, N/C fractionation was performed. Western blotting (WB) was used to examine the purities of the nuclear and cytoplasmic fraction by using UAP56 and tubulin as markers (left). Ratios of nuclear to cytoplasmic β-globin mRNAs after normalization to NEAT1 (nucleus) and GAPDH (cytoplasm) in each fraction are presented in the bar graph (right). Data represent the mean ± SEM; n = 3. (C) Western analysis was used to examine the knockdown (KD) efficiency of UAP56. (D) Similar to A, except that Cntl or UAP56 knockdown cells were used. Note that to achieve efficient mRNA nuclear retention and to avoid secondary effect, the cells were treated with UAP56 and URH49 siRNAs for 48 h. Data represent the mean ± SD from three independent experiments; n = 30. (E) RIPs with UV cross-linking were performed with an ALYREF antibody or IgG (see details in Materials and methods). Western analysis was performed by using the ALYREF antibody (left). The relative IP efficiencies of cG mRNAs to the cS mRNA were quantified and are indicated in the graph (right). Data represent the mean ± SEM; n = 3. (F) Fluorescence microscopic images show the distribution of the cG-ESE2 mRNA derived from the microinjected cG-ESE2 construct. α-Amanitin (4 µg/ml) was added at 20 min after injection, and 4 h later, FISH with the β-globin probe was performed. DAPI staining marks the nucleus. Relative N/C ratios are shown on the right. Data represent the mean ± SD from three independent experiments; n = 30. (G) The graph shows the average N/C ratios of the endogenous HSPA1A and RHOB mRNAs in cells shown in Fig. 6 E. Data represent the mean ± SD from three independent experiments; n = 30. (H) Fluorescence microscopic images show the distribution of the cG or cG-M6 mRNAs derived from microinjected constructs in cells coexpressing GFP-MS2 or MS2-SRSF2. FISH with the 3′ vector probe was performed at 4 h after injection. The graph shows the relative N/C ratios. Data represent the mean ± SD from three independent experiments; n = 30. (I) Similar to H, except that the cG-M6 and MS2-SRSF2 were coinjected into Cntl or UAP56 knockdown cells (48 h knockdown). Data represent the mean ± SD from three independent experiments; n = 30. Bars, 20 µm. Statistical analysis was performed using an unpaired t test. ***, P < 0.01. Molecular masses are given in kilodaltons.

