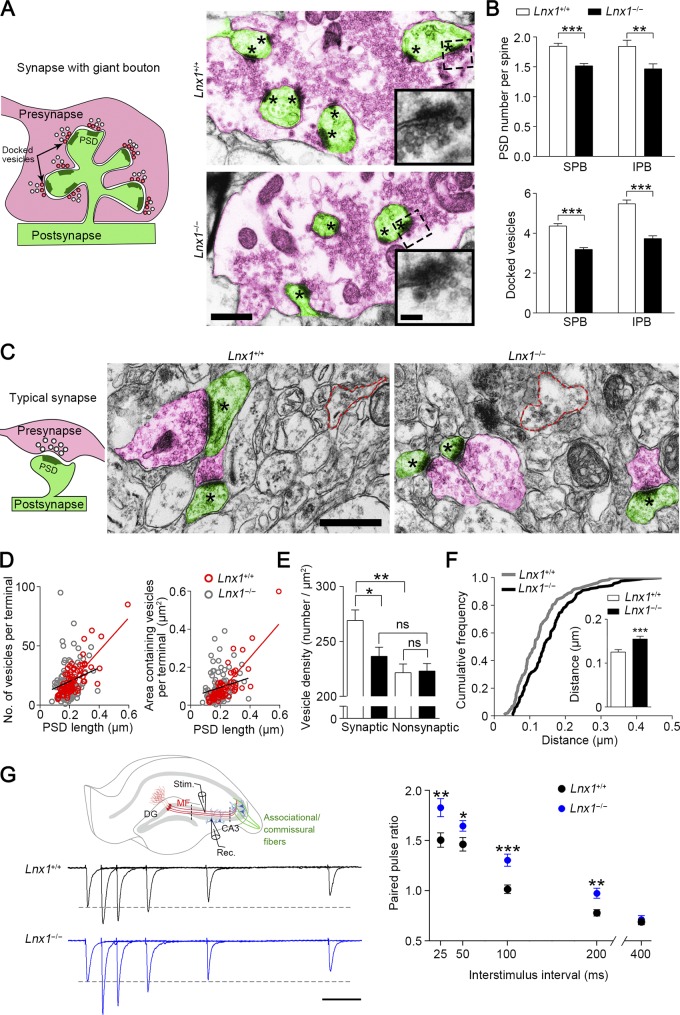
Figure 3.
Defective presynaptic maturation and function in Lnx1-null mice. (A) Schematic diagram shows synapse with giant bouton (left). Red, presynaptic terminal; green, postsynaptic spine. The docked vesicles are indicated as vesicle-contacted presynaptic membrane. Transmission electron micrographs of SPB regions from PW3 mice show MF terminals (red) and postsynaptic spines (green) in synapses with giant bouton (right). Asterisks mark PSD. The higher-magnification views show docked vesicles. Bars, 0.5 µm (left); 0.1 µm (right). (B) The PSD number per spine and docked vesicles per vesicle release site in MF synapses from SPB (301–312 synapses) or IPB (38–43 synapses) region of WT mice were more than in Lnx1−/− mice. n = 4 mice per group. (C) Schematic diagram shows typical synapse with regular bouton (left). Transmission electron micrographs from PW3 mice show axon terminals (red) and postsynaptic spines (green) in typical synapses (right). Asterisks mark PSD. Red dotted line indicates the presynaptic boutons without observed postsynaptic spine (nonsynaptic). Bars, 0.5 µm. (D) The number of vesicles per terminal (r2 = 0.62; P < 0.001) or areas of vesicles per terminal (r2 = 0.66; P < 0.001) in typical synapses were significantly correlated with PSD length in PW3 WT mice but not in Lnx1−/− mice. A dot presents a synapse. (E) The vesicle density in terminal that formed typical synapse in WT mice was more than that in Lnx1−/− mice. (F) A cumulative frequency plot of average vesicle distance from WT (n = 133 synapses) and Lnx1−/− (n = 165 synapses) mice with histogram distribution fit for the inset. n = 4 mice per group in D–F. (G) Schematic diagram in the upper panel shows EPSC recordings of the MF-CA3 pathway. Stimulating electrode was placed in the SPB layer, and recording pipette was placed in the CA3 area (between dotted line). Stim, stimulating electrode; Rec, recording pipette. Representative average traces (left) and summary graph (right) show PPRs at interstimulus intervals of 25, 50, 100, 200, and 400 ms in PW3 mice. Bar, 50 ms. n = 24–27 neurons from four mice per group. Means ± SEM; two-way ANOVA with Tukey’s post hoc test (E) or Student’s t test (B, F, and G); *, P < 0.05; **, P < 0.01; ***, P < 0.001.

