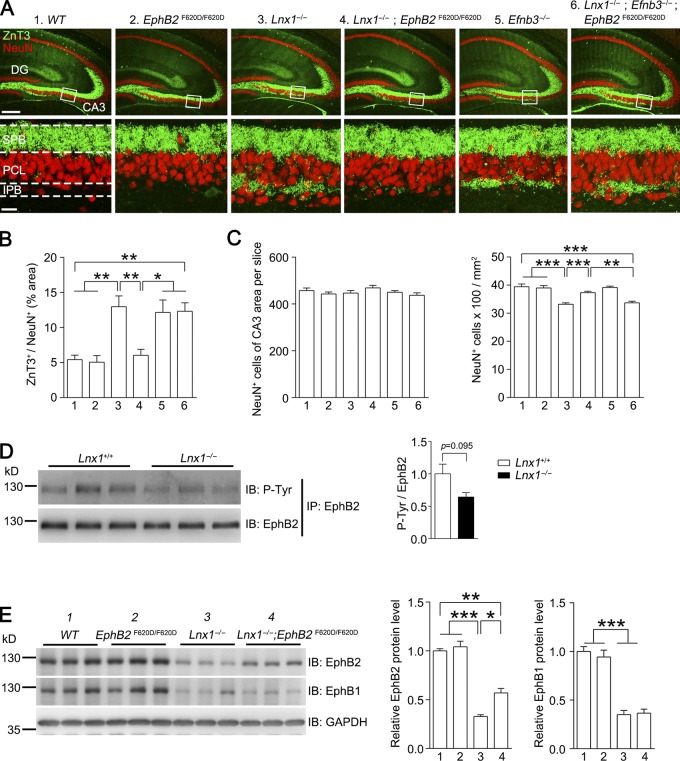
Figure 7.
EphB kinase activation promotes MF terminal targeting. (A and B) ZnT3 and NeuN staining show the IPB axon terminal–wired CA3 pyramidal cells in different mice. The robust expanded IPB axon terminals in Lnx1−/− mice were rescued in Lnx1−/−; EphB2 F620D/F620D mice but were disrupted again in Lnx1−/−; Efnb3−/−; EphB2 F620D/F620D mice. Bars, 250 µm (top); 25 µm (bottom). n = 5–6 mice per group. (C) Quantification of number of NeuN-positive cells in CA3 region in PW3 different mice. The total number of NeuN+ cells of CA3 area per slice shows no difference among these mice, while the cell density of CA3 area in Lnx1−/− mice and Lnx1−/−; Efnb3−/−; EphB2 F620D/F620D mice showed a reduction compared with other groups. n = 18–19 slices from three mice per group. (D) Immunoprecipitation (IP) of EphB2 protein from hippocampal lysates of PW3 Lnx1−/− and WT mice. The EphB2 tyrosine phosphorylation level was slightly decreased in Lnx1−/− mice compared with WT mice (P = 0.095). n = 3 mice per group. (E) The expression of EphB proteins in hippocampus from PW3 mice was detected by Western blot and quantified. The decreased EphB2 protein level in Lnx1−/− mice was partly restored in Lnx1−/−; EphB2 F620D/F620D mice, while EphB1 remained unchanged. n = 3 mice per group. Means ± SEM; one-way ANOVA with Tukey’s post hoc test (B, C, and E) or Student’s t test (D); *, P < 0.05; **, P < 0.01, ***, P < 0.001. IB, immunoblot.

