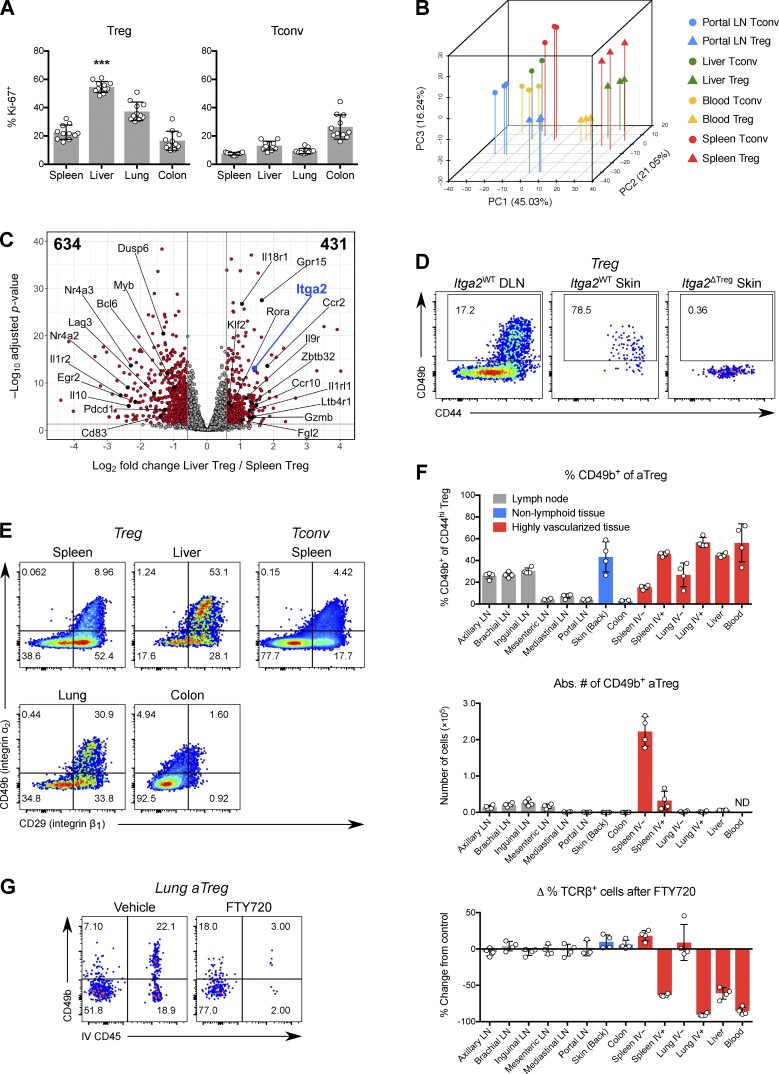
Figure 1.
A subset of activated Treg cells expresses CD49b and is enriched in vasculature and skin. (A) Percentage of Ki-67+ cells among CD4+ Foxp3+ (Treg) cells or CD4+ Foxp3− (Tconv) cells in tissues of B6 mice. Data were pooled from three independent experiments (n = 11 total). ***, P < 0.001 compared with any other group by paired t test. (B) PCA, using the top 1,000 genes with highest variance, of Treg and Tconv cells from various mouse tissues and profiled by RNA-seq. (C) Volcano plot of RNA-seq results, comparing liver and spleen Treg cells. Genes with FC ≤ 0.67 or ≥ 1.5, and adjusted P value ≤ 0.05, are shown in red and enumerated in the top left and right corners, respectively. (D) Representative flow cytometric data showing expression of CD49b and CD44 in Treg cells from ear skin or draining (cervical) LN of Foxp3YFP-Cre Itga2+/+ (Itga2WT) or Foxp3YFP-Cre Itga2fl/fl (Itga2ΔTreg) mice. DLN, draining LN. (E) Expression of CD49b (integrin α2) and CD29 (integrin β1) in Treg cells from various tissues or Tconv cells from spleen. (F) Top, percentage of CD49b+ cells among CD4+ Foxp3+ CD44hi aTreg cells from tissues of B6 mice. Most liver and all blood lymphocytes are intravascular. Intravascular cells in LNs, skin, and colon are scarce (<5%) and were gated out in this analysis. Middle, absolute number of CD49b+ aTreg cells in tissues of B6 mice. Bottom, change in the percentage of TCRβ+ NK-1.1− CD1d-tetramer− cells (of CD45+ cells) 12 h after treatment with FTY720, compared with vehicle-treated mice. IV+, intravascular CD45 labeling+; IV−, extravascular; ND, not determined. (G) CD49b expression versus intravascular CD45 labeling of lung CD44hi aTreg cells 12 h after mice were treated with FTY720 or vehicle. Data in D–G are representative of three or more independent experiments with three to five mice per group. Bars depict means ± SD. See also Fig. S1 and Fig. S2.

