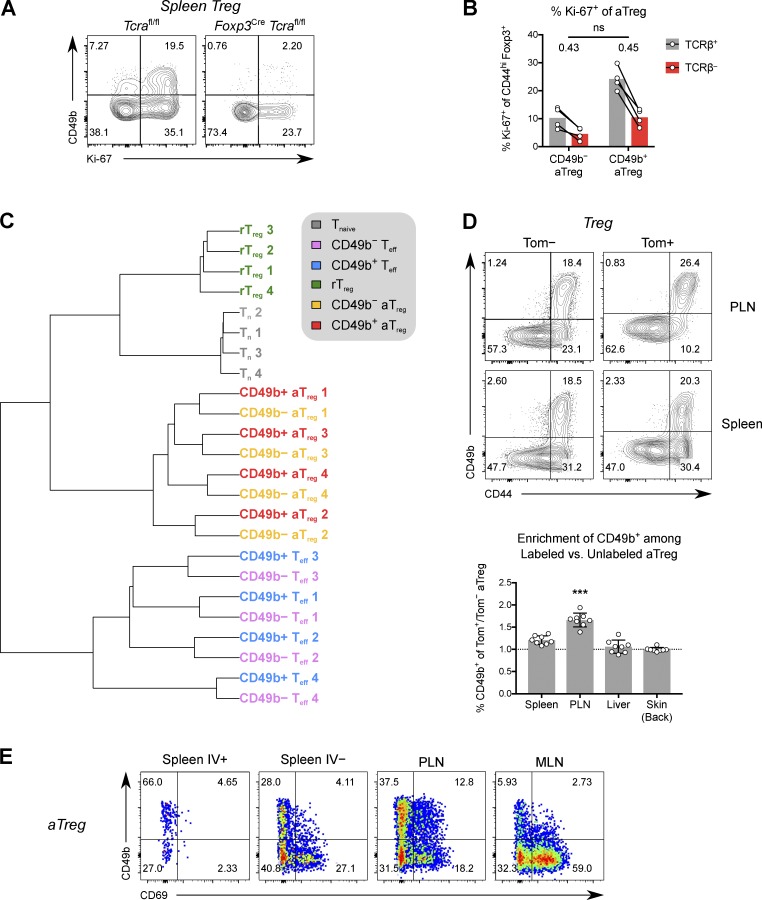
Figure 6.
Similarity of TCR repertoires suggests continuous differentiation of CD49b− to CD49b+ aTreg cells. (A) Expression of Ki-67 and CD49b in splenic Treg cells from 2.5-wk-old Foxp3YFP-Cre Tcrafl/fl or Tcrafl/fl littermate control mice. (B) Foxp3ERT2-Cre Tcra+/fl mice were given tamoxifen. The percentages of Ki-67+ cells among splenic TCRβ± CD49b± aTreg cells on day 7 is shown. ns, P > 0.05 by paired t test comparing TCRβ−/TCRβ+ FCs in CD49b− and CD49b+ aTreg cells. (C) Hierarchical clustering on F2 pairwise similarity of TCRα chain amino acid CDR3 repertoires from Treg and Tconv cell subsets from Foxp3GFP Tcra+/− DO11.10-TCRβ–transgenic mice. (D) Representative flow cytometric data and ratio of CD49b+ frequency on tagged (Tom+) versus untagged (Tom−) aTreg cells 6 wk after 7-d-old mice were given 4-OHT. ***, P < 0.001 compared with any other group (multiple t tests). (E) Representative flow cytometric data of CD49b versus CD69 expression by aTreg cells in various tissues. Data are representative of three (A, B, and E) or two (D) independent experiments. Bars depict means ± SD.

