Figure 2.
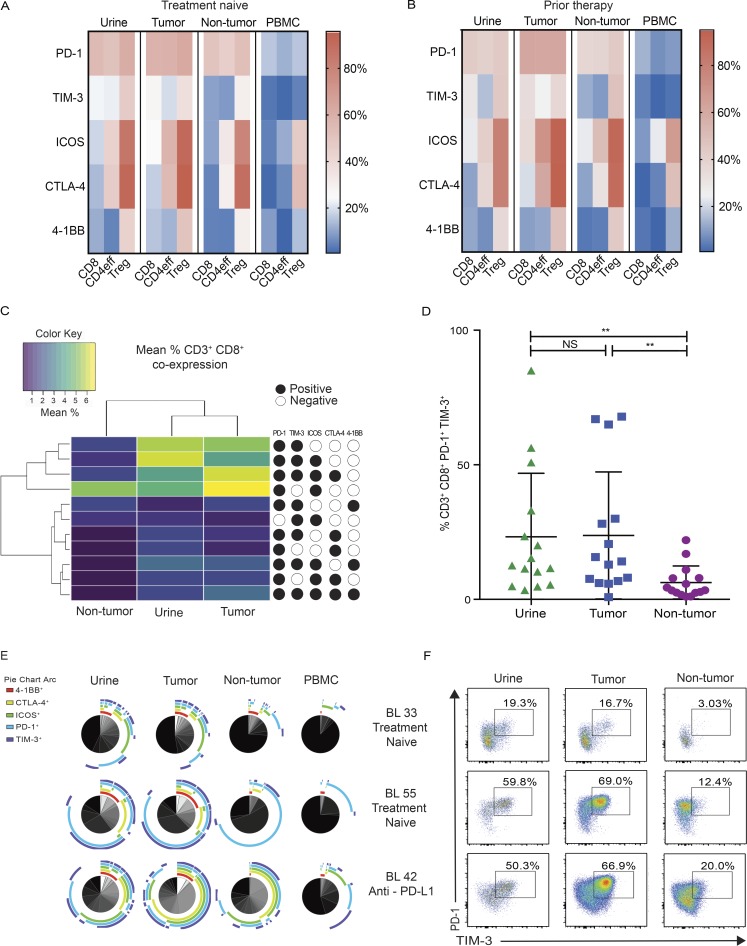
UDLs exhibit a similar checkpoint landscape to tumor-infiltrating lymphocytes independent of prior therapy. Single level expression and coexpression of B7 and TNFR superfamily coinhibitory and costimulatory molecules on T cell subsets were quantified by flow cytometry in matched urine, tumor, NT tissue, and PBMCs obtained from all patients. (A and B) Heat map depicts the mean percentage of CD8+, CD4eff, and T reg cells expressing individual immune checkpoint molecules in urine, tumor, NT, and PBMC samples obtained from treatment naive patients (n = 13; A), and patients that received prior systemic therapy (n = 19; B). (C) Displayed is an unsupervised clustering heat map of the mean frequencies of CD8+ cells demonstrating each of the coexpression immune checkpoint phenotypes in found tumor, urine, and NT tissue. Each row within the heat map represents a different immune checkpoint coexpression phenotype. Key represents the markers that define each of the coexpression phenotypes: presence of marker (black circles) or absence of marker (white circles). Only CD8+ coexpression phenotypes found at a frequency of ≥1% (mean across all patients) in any of tumor, urine, or NT are shown. (D) Graph depicts the frequency of CD8+ T cells that coexpress PD-1 and TIM-3 in tumor, urine, and NT samples. P values were calculated using paired t test. Bars represent mean values with SD. *, P < 0.05; **, P < 0.005; NS, not significant. (E) SPICE analysis of all CD8+ T cells displaying the coexpression of checkpoint molecules in urine, tumor, NT, and PBMC in a representative group of patients (BL 33, TCC treatment naive; BL 55, SCC treatment naive; BL 42, TCC neoadjuvant immunotherapy). Pie charts depict qualitative distribution of checkpoint expressions on CD8+ T cells. Arcs show checkpoint makeup and overlap within pie slice. (F) Coexpression pattern of PD-1/TIM-3 on CD8+ on urine, tumor, and NT. Dot plots display the phenotype of CD8+ lymphocytes from matched samples from the same representative patients in E (BL 33, BL 55, and BL 42). The percentage of cells expressing each combination of checkpoint molecules is shown.

