Figure 1.
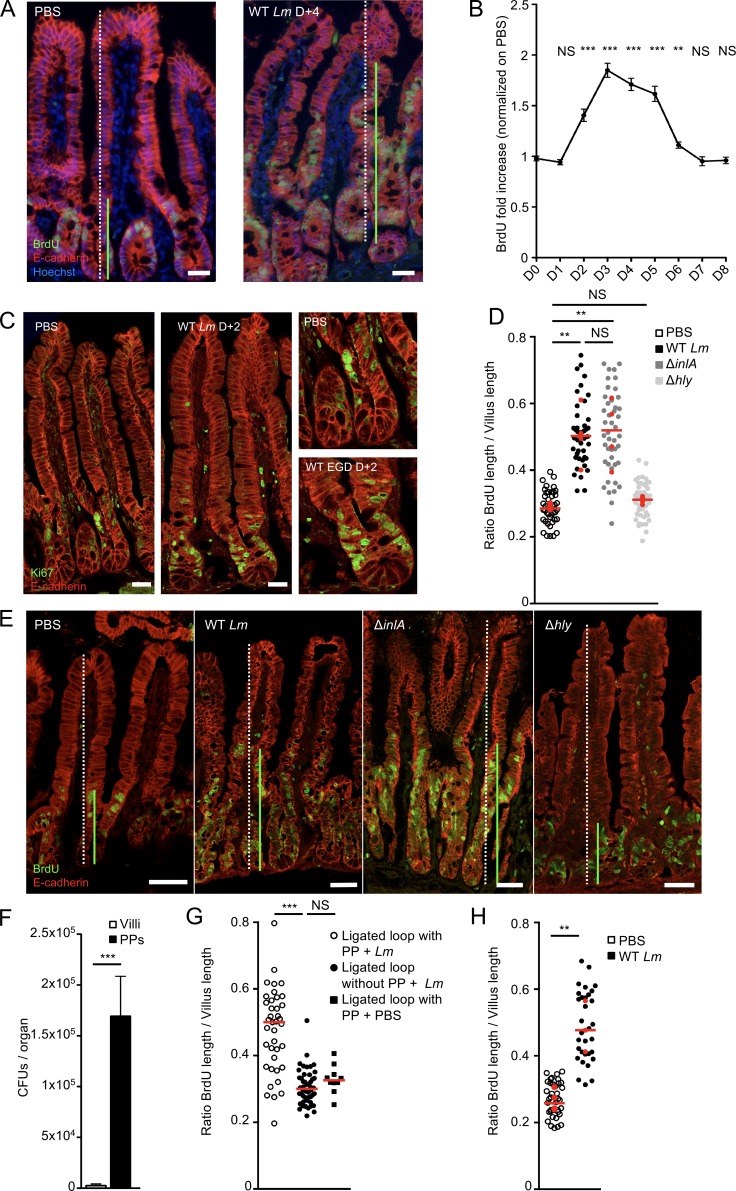
Lm-induced epithelial cell proliferation in an InlA-independent but PP-dependent manner. (A) Fluorescent imaging of sections of the ileum obtained from KIE16P mice 4 d after oral infection with 5 × 10⁹ Lm. 16 h before euthanasia, mice were injected with BrdU. Sections are stained for proliferating cells (BrdU), epithelial cells (Ecad), and nuclei (Hoechst). Bars, 20 µm. (B) Quantification over time of epithelial proliferation. Fold increase is measured by dividing the length between the first and last BrdU+ epithelial cells by the length of the villi, normalized by the proliferation from the noninfected mice. n = 9–39 villi/point. Data are pooled from three independent experiments. Mann-Whitney test. (C) Confocal imaging of sections of the ileum obtained from KIE16P mice 2 d after oral infection with 5 × 10⁹ Lm. Sections are stained for proliferating cells (Ki67) and epithelial cells (Ecad). Bars, 20 µm. (D) Quantification of epithelial proliferation in KIE16P littermate mice infected with 5 × 10⁹ Lm and isogenic mutants. Each dot corresponds to one quantified villus, except the red dots, which correspond to the mean of each mouse. At least 5 fields/10 villi per mouse. n = 4 mice/bacterial strain. Data are pooled from two independent experiments. A one-way ANOVA test followed by a Sidak’s multiple comparisons was performed on the mean of each mouse. (E) Confocal imaging of frozen sections of the ileum obtained from KIE16P mice treated as in A with 5 × 10⁹ Lm and isogenic mutants. Bars, 20 µm. (F) Lm burden in PPs and villi from mice infected by 5 × 10⁹ CFUs ΔinlA Lm. Eight mice per group. Data are represented as mean ± SEM. Mann-Whitney test. (G) Quantification of epithelial proliferation in ligated loop of KIE16P mice containing one or no PP infected with 1 × 10⁵ ΔinlA Lm 24 h pi. Each dot corresponds to one quantified villus. At least 5 fields/10 villi per mouse. n = 3–4 mice/condition. One for PP PBS control. Data are pooled from two independent experiments. A one-way ANOVA test followed by a Tukey’s multiple comparisons was performed. (H) Quantification of epithelial proliferation in axenic KIE16P littermate mice infected with 5 × 10⁹ Lm. Each dot corresponds to one quantified villus, except the red dots, which correspond to the mean of each mouse. n = 3–4 mice. Data are pooled from two independent experiments. A Student’s t test was performed on the mean of each mouse. **, P < 0.01; ***, P < 0.001.

