Figure 2.
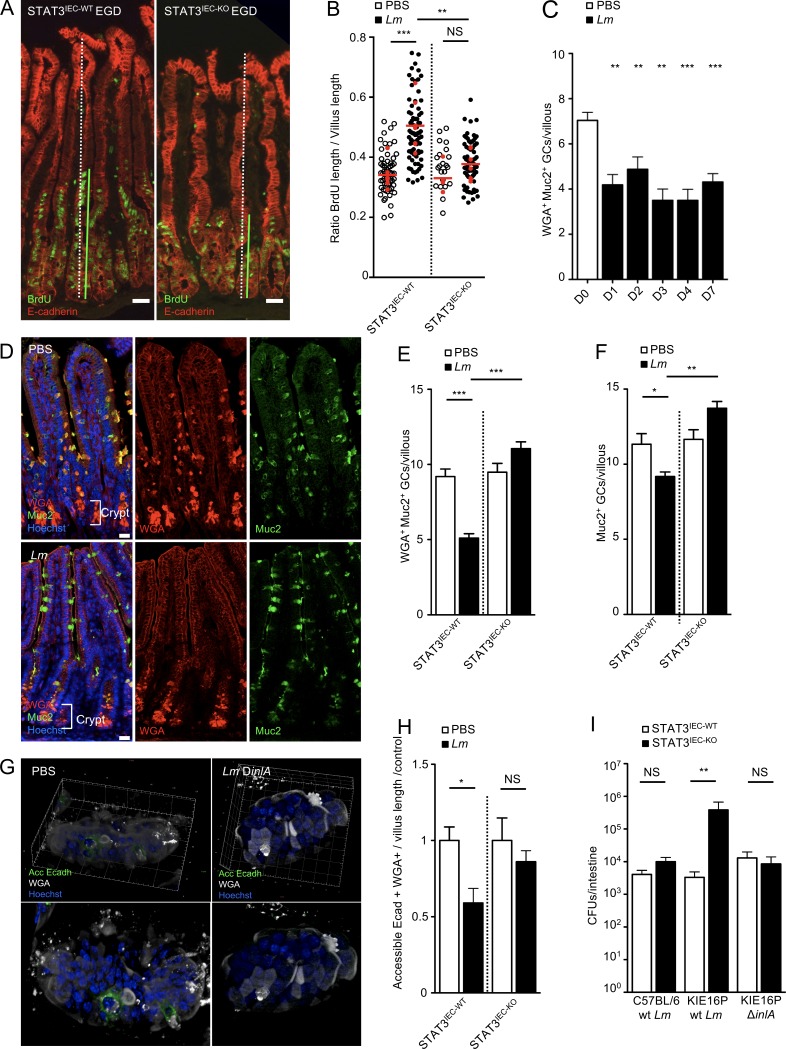
Lm triggers a STAT3-dependent negative feedback loop blocking its access to intestinal villi via GCs. (A) Confocal imaging of sections of the ileum obtained from STAT3IEC-WT and STAT3IEC-KO mice treated as in Fig. 1 A with 5 × 10⁹ Lm and isogenic mutants. Bars, 20 µm. (B) Quantification of epithelial proliferation in STAT3IEC-WT and STAT3IEC-KO littermate mice 4 d after oral inoculation. Each dot corresponds to one quantified villus, except the red dots, which correspond to the mean of each mouse. n = 3–5 mice (PBS) or 6–7 mice (Lm)/condition. Data are pooled from three independent experiments. A one-way ANOVA test followed by a Sidak’s multiple comparisons was performed on the mean of each mouse. (C) Quantification of WGA+ GCs/villous at different time points after inoculation. n = 8–25 independent villi. Data are pooled from two independent experiments. Data are represented as mean ± SEM. Mann-Whitney test. (D) Confocal imaging of sections of the ileum obtained 4 d pi with 5 × 10⁹ Lm and control. Tissue was fixed in Carnoy. Sections are stained for mucus (WGA), Muc2 mucin (Muc2), and nuclei (Hoechst). WGA+ Muc2− cells located in the crypts are Paneth cells, which are not counted. Bars, 20 µm. (E) Quantification of WGA+ GCs/villous in STAT3IEC-WT and STAT3IEC-KO mice infected by 5 × 10⁹ Lm 4 d pi and noninfected control. n = 53–95 villi. Data are pooled from two independent experiments. Data are represented as mean ± SEM. Mann-Whitney test. (F) Quantification of Muc2+ GCs/villous in STAT3IEC-WT and STAT3IEC-KO mice infected by 5 × 10⁹ Lm 4 d pi and noninfected control. n = 53–95 villi. Data are pooled from two independent experiments. Data are represented as mean ± SEM. Mann-Whitney test. (G) Three-dimensional reconstruction of nonpermeabilized intestinal villi stained with WGA and for accessible Ecad and nuclei. (H) Quantification of WGA+ GCs expressing or not accessible Ecad in STAT3IEC-WT and STAT3IEC-KO mice 4 d after inoculation of 5 × 10⁹ Lm ΔinlA from the upper 100 µm of whole mount staining. n = 17–23 villi. Data are representative of two independent experiments with at least three mice per group. Data are represented as mean ± SEM. Mann-Whitney test. (I) Lm burden in intestine of STAT3IEC-WT and STAT3IEC-KO mice infected by WT Lm or the isogenic mutant ΔinlA. A first 3-d inoculation of 5 × 10⁸ CFUs/animal was followed by a 4-d inoculation of 5 × 10⁹ CFUs/animal. Data are pooled of five independent experiments. 13 mice per group for KIE16P mice infected by WT Lm; 10 mice per group for KIE16P mice infected by Lm ΔinlA and four mice per group for C57BL/6 infected by WT Lm. Wilcoxon test; animals are paired by subgroups for each experiment. *, P < 0.1; **, P < 0.01; ***, P < 0.001.

