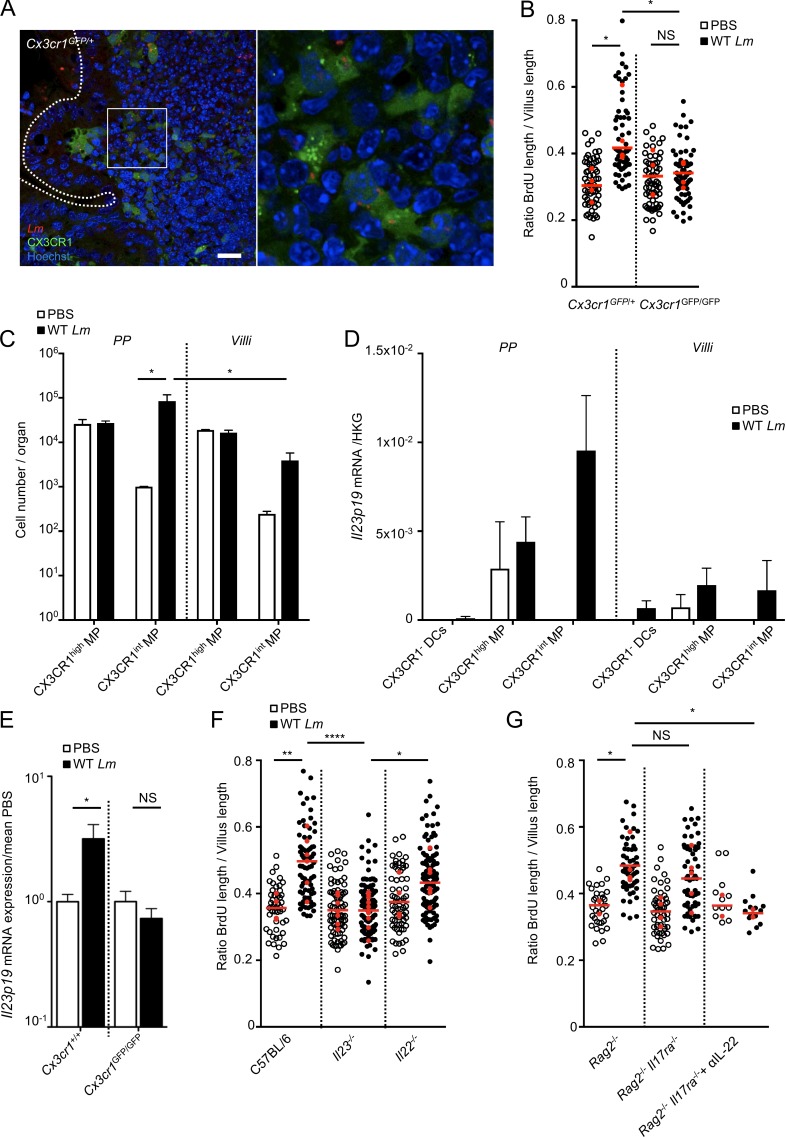
Figure 3.
IL-23 produced by CX3CR1 is involved in Lm-associated epithelial proliferation. (A) Confocal imaging of a vibratome section from a PP infected by 5 × 10⁹ Lm 24 h after oral inoculation. Bars, 20 µm. (B) Quantification of epithelial proliferation in Cx3cr1GFP/GFP and Cx3cr1GFP/+ cohoused control mice 4 d after oral inoculation. **, P < 0.01; ***, P < 0.001. Each dot corresponds to one quantified villus, except the red dots, which correspond to the mean of each mouse. n = 4 mice/condition. Data are pooled from three independent experiments. A one-way ANOVA test followed by a Sidak’s multiple comparisons was performed on the mean of each mouse. (C) Cell number per organ counted by flow cytometry. All PP versus entire intestinal tissue. Data are representative of two independent experiments with three mice per group. Data are represented as mean ± SEM. A one-way ANOVA test followed by a Sidak’s multiple comparisons was performed on the mean of each mouse. (D) Il23p19 mRNA quantification by qRT-PCR on sorted PPs and villi CX3CR1− and CX3CR1+ cells 24 h pi. Data are representative of two independent experiments with at least three mice per group. Data are represented as mean ± SEM. (E) Il23p19 mRNA quantification by qRT-PCR from intestinal tissue of Cx3cr1GFP/GFP and Cx3cr1GFP/+ mice 24 h pi. Data are pooled of three independent experiments. Six Cx3cr1+/+ mice; seven Cx3cr1GFP/GFP mice. Data are represented as mean ± SEM. Student’s t test. (F) Quantification of epithelial proliferation in control cohoused C57BL/6 and mutant mice 4 d after oral inoculation. Each dot corresponds to one quantified villus, except the red dots, which correspond to the mean of each mouse. n = 4–9 mice/condition. Data are pooled from four independent experiments. A one-way ANOVA test followed by a Sidak’s multiple comparisons was performed on the mean of each mouse. (G) Quantification of epithelial proliferation in cohoused Rag2−/− and Rag2−/−IL17ra−/− injected or not with a blocking αIL-22 antibody 4 d after oral inoculation. Each dot corresponds to one quantified villus, except the red dots, which correspond to the mean of each mouse. n = 12–57 villi. Data are pooled of two independent experiments. A one-way ANOVA test followed by a Sidak’s multiple comparisons was performed on the mean of each mouse. *, P < 0.05; **, P < 0.01; ****, P < 0.0001.

