Figure 5.
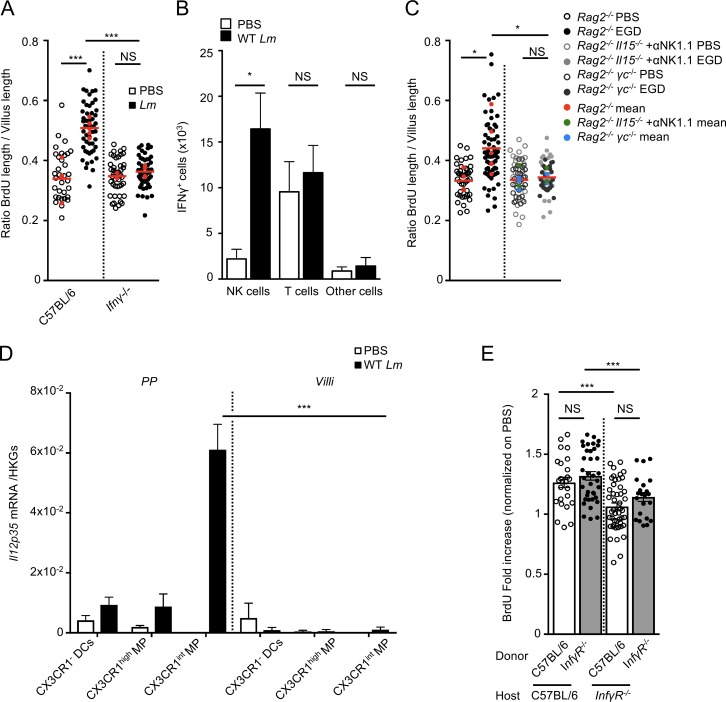
IFN-γ produced by NK cells is involved in Lm-associated epithelial proliferation. (A) Quantification of epithelial proliferation in cohoused C57BL/6 control and Ifnγ−/− mice 4 d after oral inoculation. Each dot corresponds to one quantified villus, except the red dots, which correspond to the mean of each mouse. At least 5 fields/10 villi per mouse. n = 3–5 mice/condition. Data are pooled of two independent experiments. A one-way ANOVA test followed by a Sidak’s multiple comparisons was performed on the mean of each mouse. (B) Quantification by flow cytometry analysis of IFN-γ+ cells. Data are pooled of three independent experiments. n = 4–5 animals per group. Data are represented as mean ± SEM. Student’s t test. (C) Quantification of epithelial proliferation in cohoused Rag2−/−, Rag2−/− γc−/−, Rag2−/−Il15−/− injected with a blocking αNK1.1 antibody 4 d after oral inoculation. Each dot corresponds to one quantified villus, except the red, green, and blue dots which correspond to the mean of each mouse. n = 3–6 mice per condition. Data are pooled of two independent experiments. A one-way ANOVA test followed by a Sidak’s multiple comparisons was performed on the mean of each mouse. (D) I12p35 mRNA quantification by qRT-PCR on sorted PPs and villi CX3CR1− and CX3CR1+ cells 24 h pi. Data are representative of two independent experiments with at least three mice per group. Data are represented as mean ± SEM. Student’s t test. (E) Quantification of epithelial proliferation in C57BL/6:IfnγR−/− and IfnγR−/−:C57BL/6 chimera mice 4 d after oral inoculation. Data are pooled of two independent experiments with two to four mice per group. *, P < 0.05; **, P < 0.01; ***, P < 0.001.

