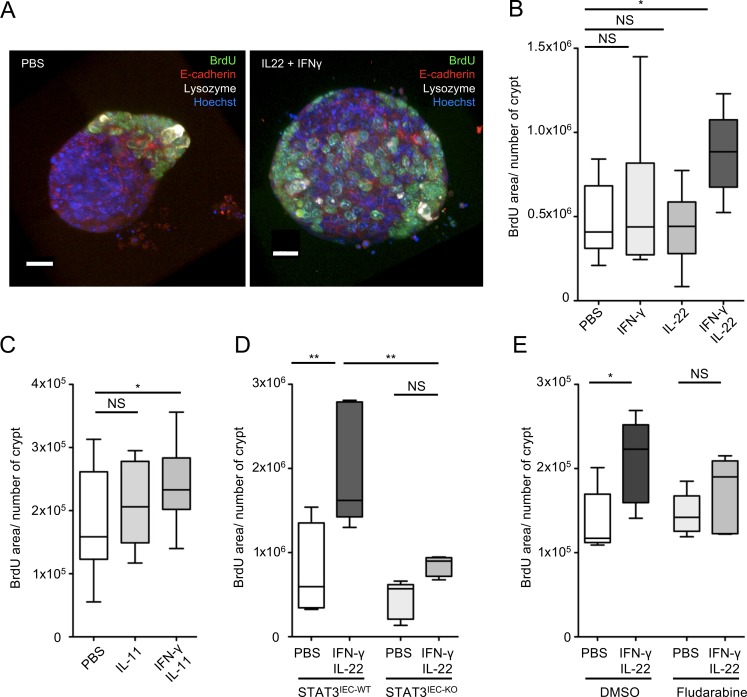
Figure 6.
IL-23 and IFN-γ pathways complement to induce epithelial proliferation. (A) Maximum intensity projection of Z stacks from organoids incubated with the indicated cytokines. (B) Quantification of BrdU incorporation in organoids incubated with the indicated cytokines and treatment, detailed in the supplemental procedures. n = 8–10 pooled organoids from two independent experiments. A one-way ANOVA test followed by a Sidak’s multiple comparisons was performed. (C) Quantification of BrdU incorporation in organoids incubated with the indicated cytokines and treatment, detailed in the supplemental material. n = 15–17 pooled organoids from three independent experiments. A one-way ANOVA test followed by a Sidak’s multiple comparisons was performed. (D) Quantification of BrdU incorporation in organoids incubated with the indicated cytokines and treatment, detailed in the supplemental material. n = 4 (PBS) or 5 (IFN-γ + IL-22) organoids pooled from two plates, representative of two independent experiments. A one-way ANOVA test followed by a Sidak’s multiple comparisons was performed. (E) Quantification of BrdU incorporation in organoids incubated with the indicated cytokines and treatment, detailed in the supplemental material. n = 5 organoids pooled from two plates for each condition. A one-way ANOVA test followed by a Sidak’s multiple comparisons was performed. *, P < 0.05; **, P < 0.01.

