Figure 5.
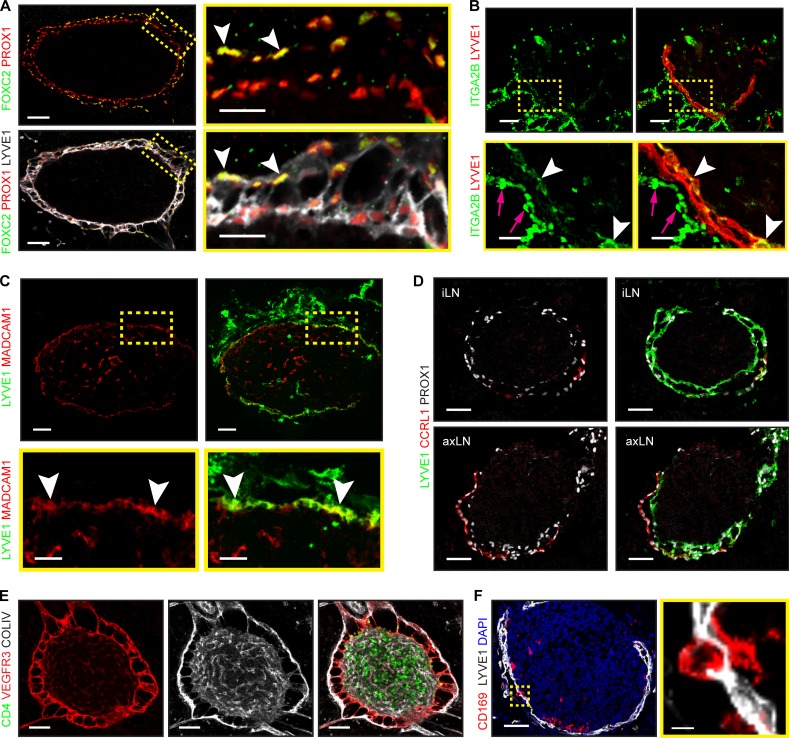
Prenatal SCS LEC specification coincides with lymphatic vascular maturation. (A) Collecting and capillary LEC markers in iLN lymphatics. Whole mount iLN (5-µm transverse section): FOXC2 (green), PROX1 (red), and LYVE1 (white). Arrowheads indicate PROX1+/FOXC2+ LECs. High-magnification images are shown on the right. E20.5, n = 1. The same expression pattern was observed at E16.5 (n = 3) and E18.5 (n = 1). Scale bars, 50 µm and 20 µm. (B) Staining of iLN for ITGA2B (green) and LYVE1 (red). High-magnification images are shown at the bottom. Arrowheads indicate ITGA2B+ LECs; arrows indicate blood. E18.5, n = 3. Scale bars, 50 µm and 15 µm. (C) Staining of axLN for MADCAM1 (red) and LYVE1 (green). High-magnification images are shown at the bottom. Arrowheads indicate MADCAM1+ LECs. E18.5–E20.5, n = 5. Scale bars, 50 µm and 20 µm. (D) Staining of E20.5 inguinal (iLN) and axillary (axLN) for CCRL1 (red), PROX1 (white), and LYVE1 (green). axLN, n = 4; iLN, n = 3. Scale bar, 50 µm. (E) LEC pillars connect two LN capsule layers. Whole mount (5-µm transverse section): collagen IV (white), VEGFR3 (red), and CD4 (green). E19.0, n = 3. Scale bar, 50 µm. (F) CD169+ macrophages in the iLN SCS. Staining for CD169 (red), LYVE1 (white), and DAPI (blue). High-magnification image is shown on the right. E18.5–E20.5 iLN, n = 4. Scale bars, 50 µm and 5 µm.

