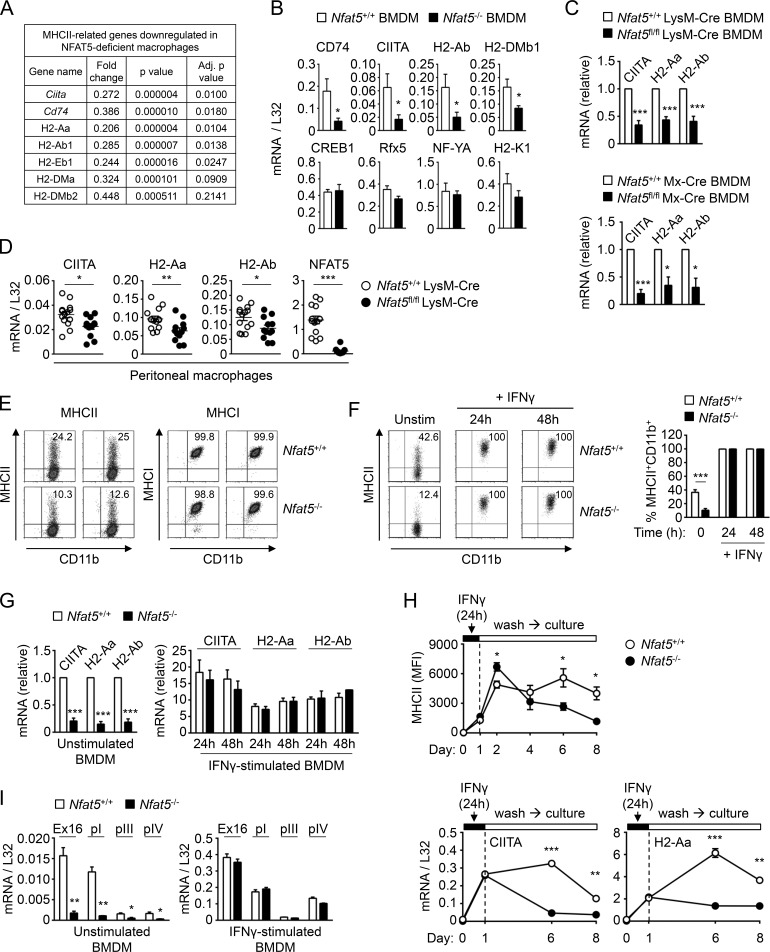
Figure 1.
MHCII expression in wild-type and NFAT5-deficient macrophages. (A) Reduced mRNA expression of MHCII-related genes in NFAT5-deficient BMDMs identified by microarray analysis (see Table S1 for additional genes). (B) mRNA expression of CIITA, H2-Ab, CD74, and H2-DMb1; MHCII regulatory factors Rfx5, NF-YA, and CREB1; and the MHCI gene H2-K1 in wild-type (Nfat5+/+) and NFAT5-deficient (Nfat5−/−) BMDMs. Values show the mean ± SEM of four independent experiments, each comparing BMDMs from one NFAT5-deficient mouse and a wild-type littermate. (C) CIITA and MHCII mRNA expression was analyzed by RT-qPCR in BMDMs from conditional NFAT5 deletion models. Values show the mean ± SEM of three independent experiments for LysM-Cre and six for Mx-Cre NFAT5 deletion models. Each experiment compared BMDMs from one NFAT5-deficient mouse and a wild-type littermate. Data for each respective mRNA are shown normalized to the wild-type sample, which was given a value of 1. (D) CIITA and MHCII mRNA expression in peritoneal macrophages from wild-type (Nfat5+/+ LysM-Cre) and Nfat5fl/fl LysM-Cre conditional KO. Each circle represents one individual mouse. Data are from 14 wild-type and 12 Nfat5fl/fl LysM-Cre conditional KO mice compiled through six independent experiments. (E) Flow cytometry analysis of MHCII and MHCI protein expression in BMDM from Nfat5+/+ LysM-Cre (wild-type, Nfat5+/+) and Nfat5fl/fl LysM-Cre mice (KO, Nfat5–/–) in two independent pairs of littermates. (F) Left: Representative flow cytometry analysis of MHCII expression in wild-type (Nfat5+/+) and NFAT5-deficient (Nfat5−/−) BMDMs. Right: Percentage of MHCII+ macrophages from BMDM cultures of littermate wild-type and NFAT5-deficient mice, either left unstimulated or treated with IFNγ (400 U/ml) for 24 or 48 h. Data are from six independent experiments with unstimulated cells and four more including unstimulated as well as IFNγ-treated macrophages. (G) mRNA levels of CIITA and MHCII genes in wild-type (Nfat5+/+) and NFAT5-deficient (Nfat5−/−) BMDMs, either left untreated (left) or stimulated with IFNγ (400 U/ml) for 24 or 48 h (right). Values for IFNγ-stimulated cells are represented relative to unstimulated cells, set as 1 for each respective gene in wild-type macrophages. Results are the mean ± SEM of three independent experiments, each comparing BMDMs from one NFAT5-deficient mouse and a wild-type littermate. (H) Expression of MHCII in wild-type and NFAT5-deficient BMDMs analyzed in basal conditions, after 24 h of IFNγ stimulation (100 U/ml), and at different days after washing out IFNγ. The upper panel shows the analysis of MHCII mean fluorescence intensity (MFI) in three independent pairs of wild-type and NFAT5-deficient BMDMs (mean ± SEM). Bottom panels show mRNA expression of CIITA and H2-Aa in the same experiment (mean ± SEM, n = 3). (I) Expression of CIITA transcripts from its different promoters (pI, pIII, and pIV) in wild-type (Nfat5+/+) and NFAT5-deficient (Nfat5–/–) BMDMs, either left unstimulated or stimulated with IFNγ for 24 h. CIITA Ex16 corresponds to an mRNA region common to all CIITA transcripts, which spans exons 16 to 18 in Ciita transcript NM_001243760.2 transcribed from promoter I. Values show the mean ± SEM of three independent experiments, each comparing BMDMs from one NFAT5-deficient mouse and a wild-type littermate. Statistical significance in B, D, F, H, and I was determined with an unpaired t test, and in C and G with a one-sample t test using the respective wild-type cells as reference with a value of 1. *, P < 0.05; **, P < 0.01; ***, P < 0.001.

