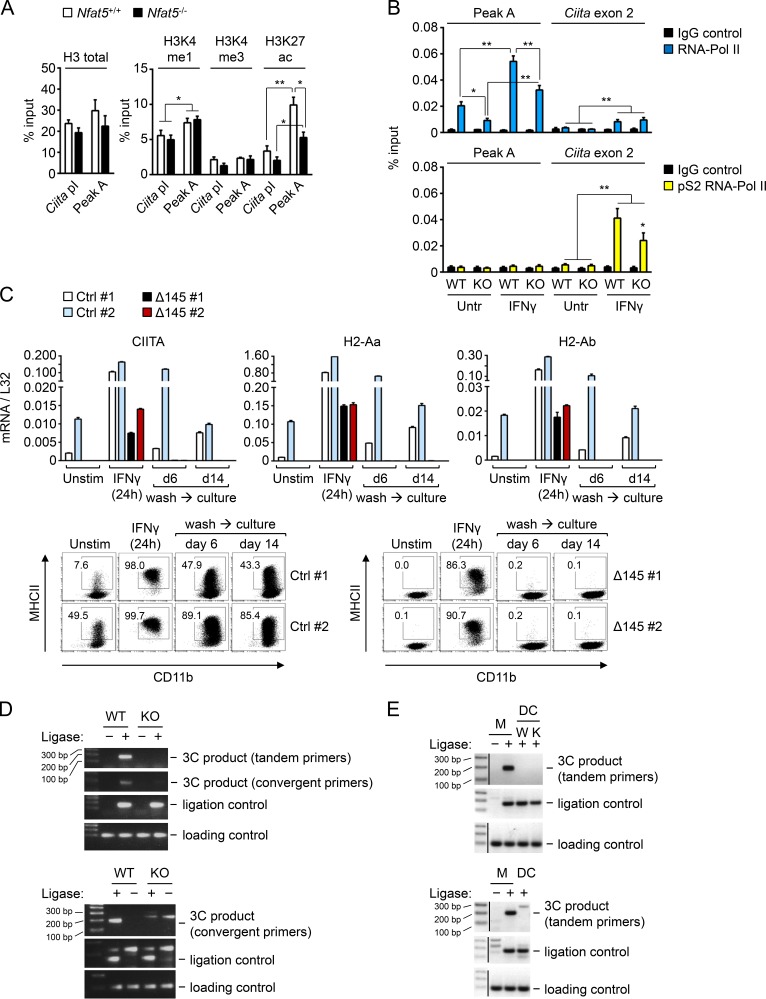
Figure 5.
Characterization of NFAT5-binding site peak A upstream Ciita. (A) qChIP assays with antibodies specific for histone H3 and its indicated modifications in peak A and Ciita promoter I (Ciita pI) in wild-type and NFAT5-deficient BMDMs. Results show the mean ± SEM of four independent experiments, each comprising BMDMs from one NFAT5-deficient mouse and a wild-type littermate. *, P < 0.05; **, P < 0.01. (B) qChIP assays comparing the binding of RNA-Pol II and its transcription elongation-associated form (phosphorylated serine 2 of its CTD) to peak A and exon 2 of Ciita in wild-type (WT) and NFAT5-deficient (KO) BMDMs left untreated or stimulated with IFNγ (400 U/ml, 4 h). Results show the mean ± SEM of four independent experiments, each comparing one pair of BMDM cultures from wild-type and NFAT5-deficient littermate mice. Statistical significance was determined by an unpaired t test. *, P < 0.05; **, P < 0.01. (C) Effect of deletion of peak A on CIITA and MHCII expression in iBMDMs. Upper panels show mRNA expression of CIITA, H2-Aa, and H2-Ab in two control clones (Ctrl) and two clones with deletion of a 145-bp region in peak A comprising the two consensus NFAT5 binding sites (Δ145), following the CRISPR-Cas9 approach described in Fig. S4. Lower panels show the time course of MHCII protein expression analyzed in parallel by flow cytometry. Results shown are from one experiment comparing the respective clones in basal conditions, 24 h after IFNγ stimulation, and 6 and 14 d after washing out IFNγ. Reduced expression of MHCII expression in Δ145 clones was confirmed in two additional independent flow cytometry analyses (data not shown). (D) Two independent 3C experiments (representative of four independently performed experiments) showing the NFAT5-dependent intrachromosomal looping between peak A and Ciita promoter I in macrophages, detected by PCR amplification with diagnostic convergent and tandem primers. See Fig. S5 for a diagram of the 3C assay and sequencing analysis of the amplified 3C bands. (E) Two independent 3C experiments comparing the formation of intrachromosomal looping between peak A and Ciita promoter I in BMDMs (M) and myeloid conventional DCs. The upper panel includes wild-type (W) and NFAT5-deficient DCs (K).

