Figure 1.
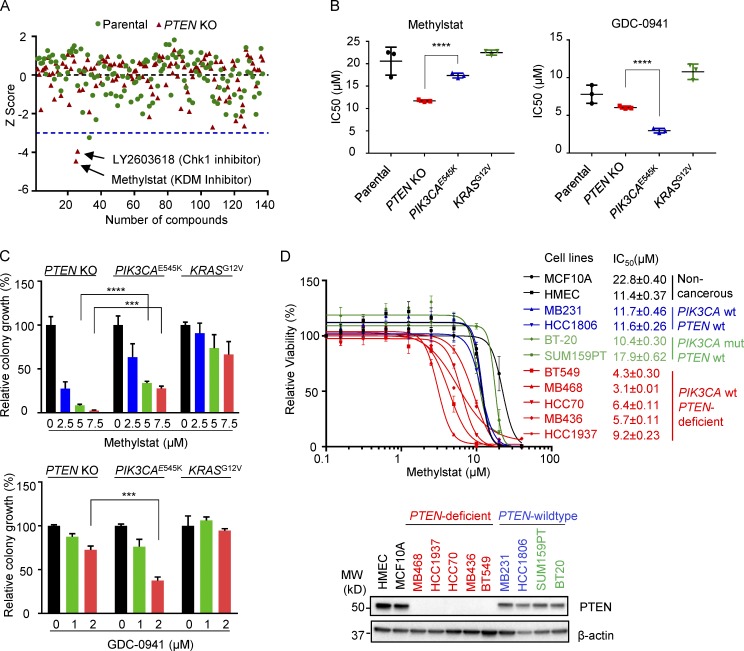
Drug screening identifies KDM inhibitor Methylstat selectively impairing PTEN-deficient breast cancer cells. (A) MCF10A parental and PTEN-KO cells treated for 4 d with a compound library consisting of 140 small molecule inhibitors. Cell viability was assessed using a CellTiter-Glo Luminescent Cell Viability Assay. Shown is the scatter plot of z-scores normalized to DMSO control in MCF10A parental (green) and PTEN-KO cells (red). Blue dashed line indicates a z-score of –3 as the significance threshold. (B) IC50s of Methylstat or GDC-0941 in indicated isogenic MCF10A cells as determined by a CellTiter-Glo Luminescent Cell Viability Assay. (C) Colony formation assay was performed in indicated isogenic MCF10A cells in 0.5% methylcellulose containing the indicated concentration of Methylstat or GDC-0941 for 1 wk. Representative data of two independent experiments are shown. (D) IC50s of Methylstat in indicated breast cell lines with different PTEN and PIK3CA status. Top: Cells were treated with Methylstat for 3 d, and viability was assessed using a CellTiter-Glo Luminescent Cell Viability Assay. Bottom: Western blot analysis of PTEN in indicated breast cell lines. MW, molecular weight. See also Fig. S1. All data are representative of three independent experiments unless stated otherwise. Data are expressed as means ± SD. P values were determined by two-tailed unpaired Student’s t test; *** P ≤ 0.001, **** P ≤ 0.0001.

