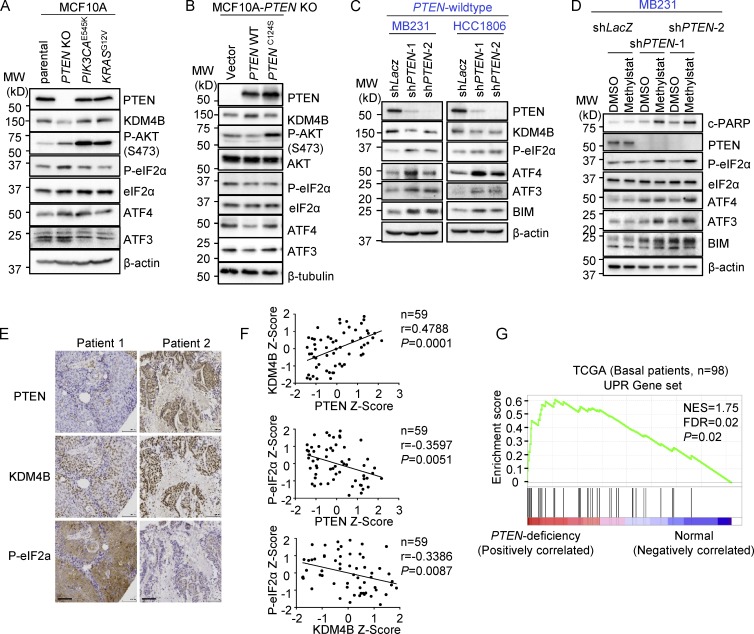
Figure 4.
PTEN loss results in down-regulation of KDM4B and activation of UPR. (A) Western blot analysis of the UPR pathway in indicated isogenic MCF10A cell lines. MW, molecular weight. (B) Western blot analysis of UPR in PTEN-KO–MCF10A cells with ectopic expression of wild-type PTEN and PTEN-C124S proteins. (C) Western blot analysis of PTEN wild-type MB231- and HCC1806-expressing PTEN shRNAs. (D) Western blot analysis of the UPR pathway in MB231 cells expressing PTEN shRNAs treated with vehicle or Methylstat (2.5 µM) for 24 h. (E) Representative IHC staining of PTEN, KDM4B, and P-eIF2α in a TNBC tumor specimen. Scale bars, 100 µm. (F) Correlation analysis of IHC staining in tissue microarray between PTEN, KDM4B, and P-eIF2α in TNBC patients (n = 59). Pearson correlation coefficient and two-tailed P values are shown. (G) GSEA was performed with UPR gene signatures (which was implicated in protein folding or translational control and ER-associated protein degradation; see Table S3) on TCGA dataset where PTEN deficiency–related genes were ordered from largest to smallest in 98 basal patients. Basal patients with deep deletion, mutation, mRNA down-regulation, and/or protein down-regulation of PTEN were defined as PTEN deficient; the rest were defined as PTEN wild-type (PTEN deficiency, n = 27; PTEN wild-type, n = 71). NES, normalized enrichment score; FDR, false discovery rate. See also Fig. S3 and Table S3. All Western blot data are representative of three independent experiments.

