Figure 1.
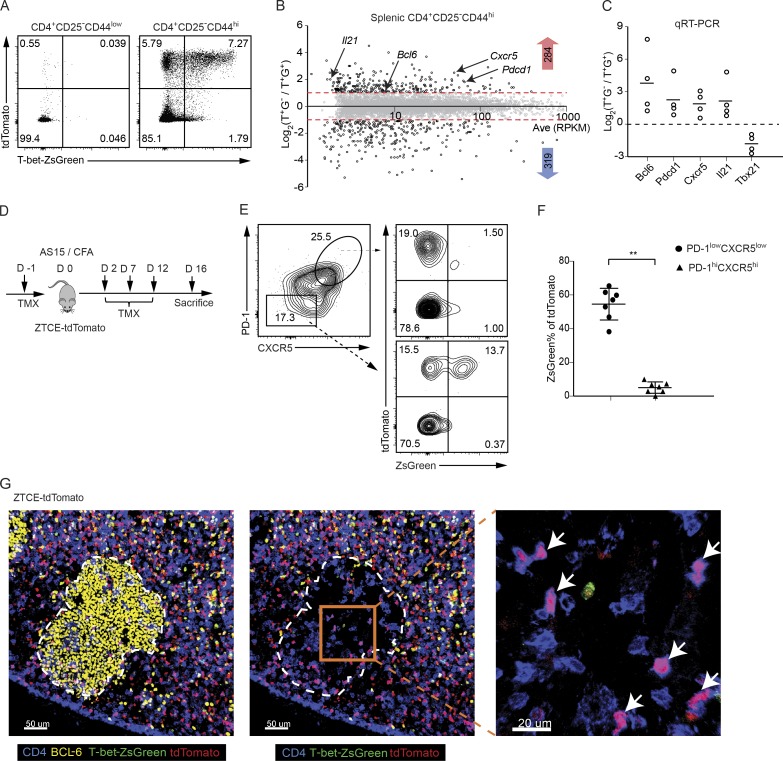
Tfh cells in GCs do not express T-bet but some have a history of T-bet expression. (A) ZTCE-tdTomato mice were treated (i.p.) with TMX on days 0, 2, and 5. After 10 d, the expression of ZsGreen and tdTomato by the splenic naive CD4 T cells (CD4+CD44lowCD25−) and memory-like CD4 T effector cells (CD4+CD44hiCD25−) cells was assessed by flow cytometry. The plot represents a typical profile from more than five experiments. (B) Splenic CD4+CD44highCD25−tdTomato+ZsGreen− (T+G−) and CD4+CD44highCD25−tdTomato+ZsGreen+ (T+G+) cells sorted from TMX-treated naive ZTCE-tdTomato mice were used for RNA-Seq analysis. Samples are in biological duplicates. (C) Relative gene expression levels of Tfh-related genes in CD4+CD44highCD25−tdTomato+ZsGreen− (T+G−) and CD4+CD44highCD25−tdTomato+ZsGreen+ (T+G+) populations were measured by qRT-PCR (n = 4). Data are representative of three independent experiments. (D) Experimental procedure of immunizing ZTCE-tdTomato mice with AS15/CFA. (E and F) ZTCE-tdTomato mice were immunized with AS15/CFA for 16 d and treated with TMX as shown in D. dLN cells were analyzed by flow cytometry. The percentage of ZsGreen+ cells among the tdTomato+ cells was calculated for the PD-1lowCXCR5low non-Tfh and PD-1hiCXCR5hi Tfh populations (mean ± SD; n = 7; *, P < 0.0001). Data are representative of three independent experiments. (G) ZTCE-tdTomato mice were treated as in D. Different cell types in GC were analyzed by multicolor tissue imaging. GC (yellow, BCL-6); ex–T-bet-Tfh cell (pink, CD4-blue and tdTomato-red); T-bet-ZsGreen-green. Arrows indicate ex–T-bet-Tfh cells in GC. Data are representative of two independent experiments with two animals in each experiment.

