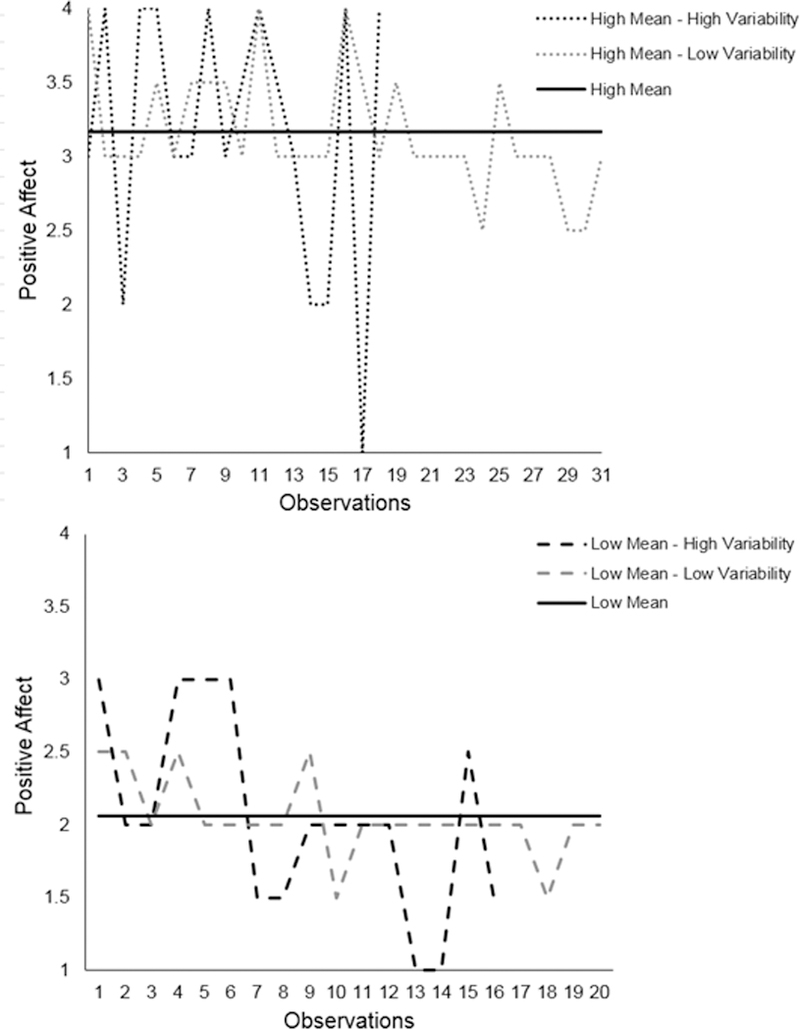
Figure 1. An example of inter-individual differences in mean levels and volatility in EMA ratings of positive affect.

The top panel displays EMA ratings of positive affect for two individuals with relatively high mean levels of positive affect but different degrees of variability in positive affect. The bottom panel displays EMA ratings of positive affect for two individuals with relatively low mean levels of positive affect but different degrees of variability in positive affect.
