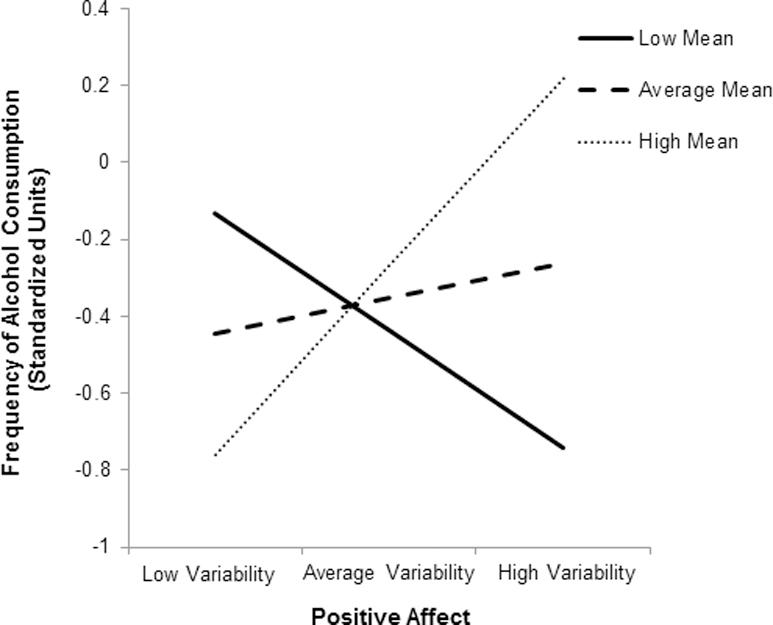
Figure 3. Interaction between mean level and variability in positive affect predicting frequency of alcohol consumption in the past 30 days.

Low and high mean and variability refer to 1.5 standard deviations below and above the mean, respectively.

Low and high mean and variability refer to 1.5 standard deviations below and above the mean, respectively.