
Figure 2. Allelic effect estimates for Neanderthal-introgressed variants.
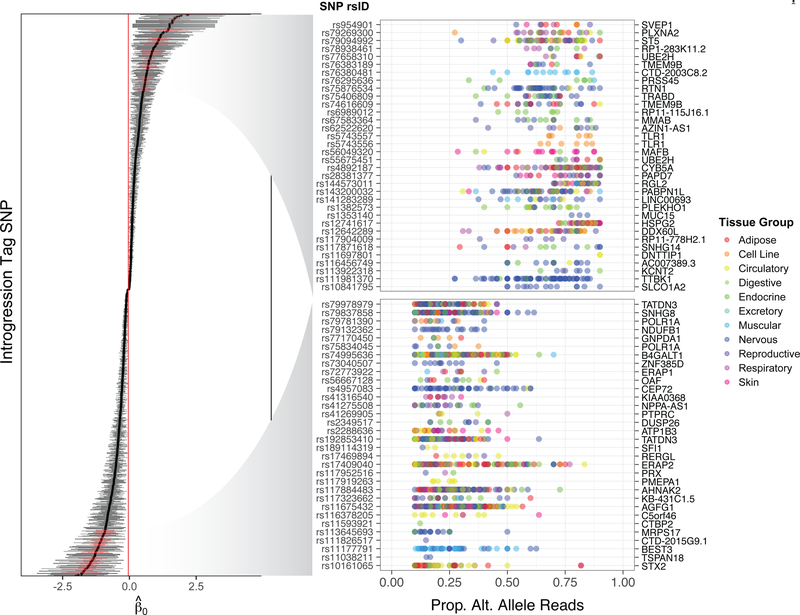
Estimates for 1236 Neanderthal tag SNPs exhibiting significant ASE at 10% FDR. Error bars indicate 95% credible intervals. The right panel depicts allelic imbalance at selected SNPs (highlighted in red) showing strongest evidence of ASE (lowest posterior predictive p-values in each tail [P < 1 × 10⁻⁵]). Each point represents one sample and is color-coded according to tissue group to convey the diversity of tissue expression patterns. See also Figure S2 and Table S2.