
Figure 4. Evidence of purifying selection on introgressed regulatory variation.
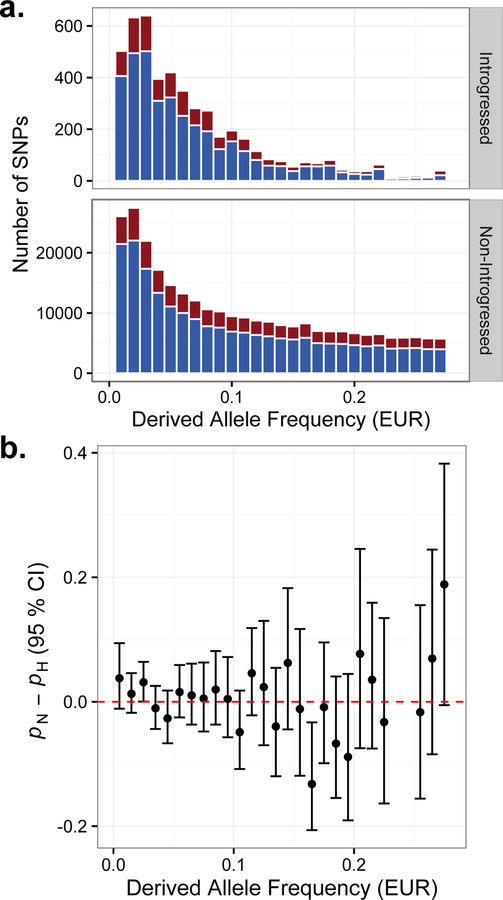
(a) Allele frequency spectra of variants tagging Neanderthal-introgressed haplotypes (upper panel) and non-introgressed variants (bottom panel). SNPs with significant ASE are plotted in red, and while non-significant SNPs are plotted in blue in the stacked histograms. (b) No significant differences in the estimated proportions of introgressed (pN) and non-introgressed (pH) variants showing significant ASE (at 10% FDR), stratified by derived allele frequency. Error bars indicate 95% credible intervals.