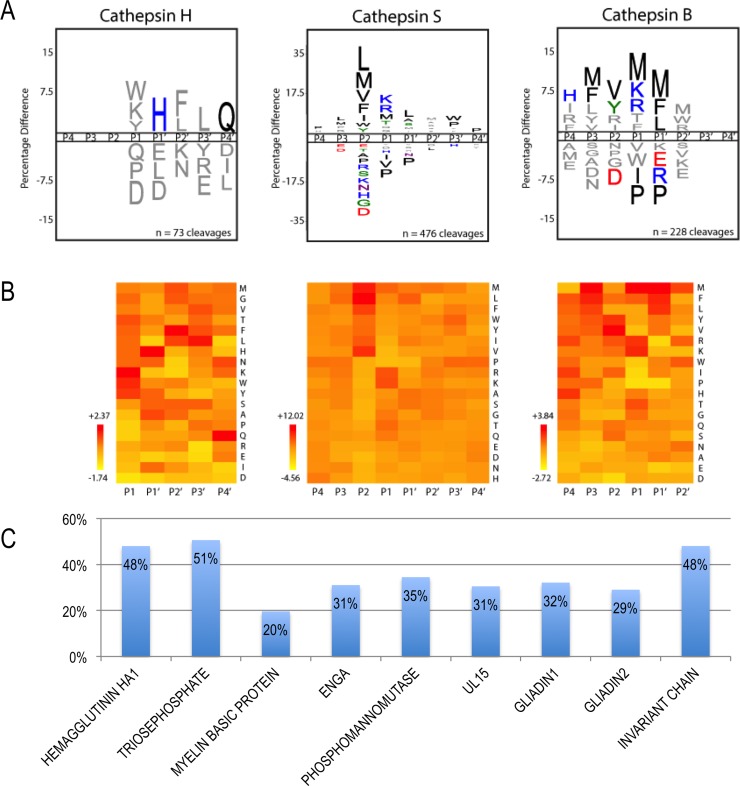
Fig 2.
A and B) Cleavage profiles for cathepsins H, S, and B. A) iceLogo representations of substrate specificity. Residues above the line are favored at a given position; residues below the line are disfavored. Statistically significant residues (p < 0.05) are colored according to their physicochemical properties. B) Heat map representations of residue preference clustered and colored by Z-score at each position. Favored residues have Z > 0 and disfavored residues have Z < 0. Cleavage profiles are provided from P1-P4’ for cathepsin H, P4-P4’ for cathepsin S, and P4-P2’ for cathepsin B based on their predominant experimentally-determined cleavage preferences. C) Percentage of 12-mer peptides in the benchmark proteins remaining, following filtering by the cleavage sites predictor.

