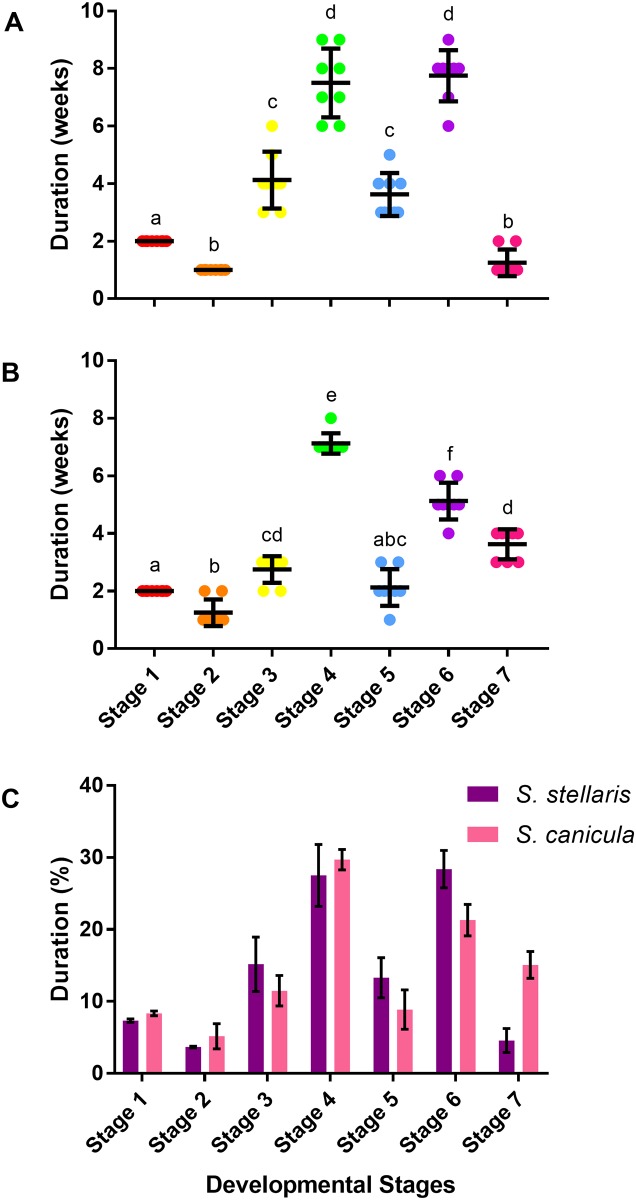
Fig 13. Duration of development time of the 7 developmental stages.
A: Duration of development time (in weeks) spent in each of the 7 developmental stages for S. stellaris embryos. Lines show mean ± SD (n = 8), while points show measurements from each individual. Dissimilar letters indicate statistical differences between stages (RM one-way ANOVA, P < 0.05). B: Duration of development time (in weeks) spent in each of the 7 developmental stages for S. canicula embryos. Lines show mean ± SD (n = 8), while points show measurements from each individual. Dissimilar letters indicate statistical differences between stages (RM one-way ANOVA, P < 0.05). C: Comparison of duration of development time (as % of total time) between S. stellaris (purple) and S. canicula (pink) embryos at 7 developmental stages. Values represent mean ± SD (n = 8). There was no statistically significant difference between species (Mann-Whitney U test, P < 0.05).

