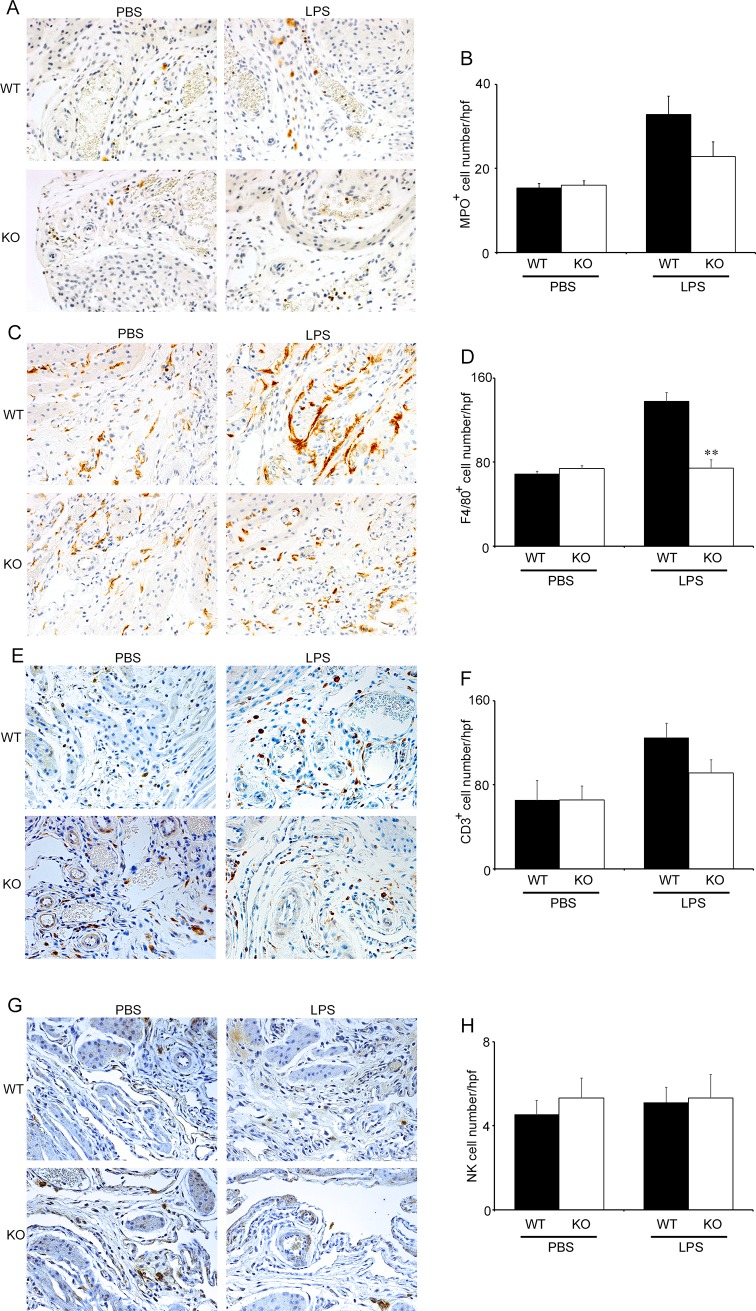
Fig 4. The comparison of intrauterine leukocyte recruitment between WT and Cx3cr1-/- mice.
Evaluation of intrauterine leukocyte infiltration in WT and KO mice at 6 h after PBS or LPS injection (25 μg/mouse) at gd 15.5. Immunohistochemical analysis was performed using anti-MPO pAbs (A and B), anti-F4/80 mAb (C and D), anti-CD3 pAbs (E and F), and anti-pan NK cell mAb (G and H) as described in Materials and Methods. Representative results from 6 independent experiments are shown in panels A, C, E, and G. Original magnification, ×400. Enumeration of each leukocyte population including neutrophils (B), macrophages (D), T cells (F), and NK cells (H) in WT and KO mice at 6 h after PBS or LPS (25 μg/mouse) injection at gd 15.5. All values represent the mean ± SEM; Statistical significance determined using Mann-Whitney’s U test. **P < 0.01 vs. WT (n = 5–8 cases in each group).

