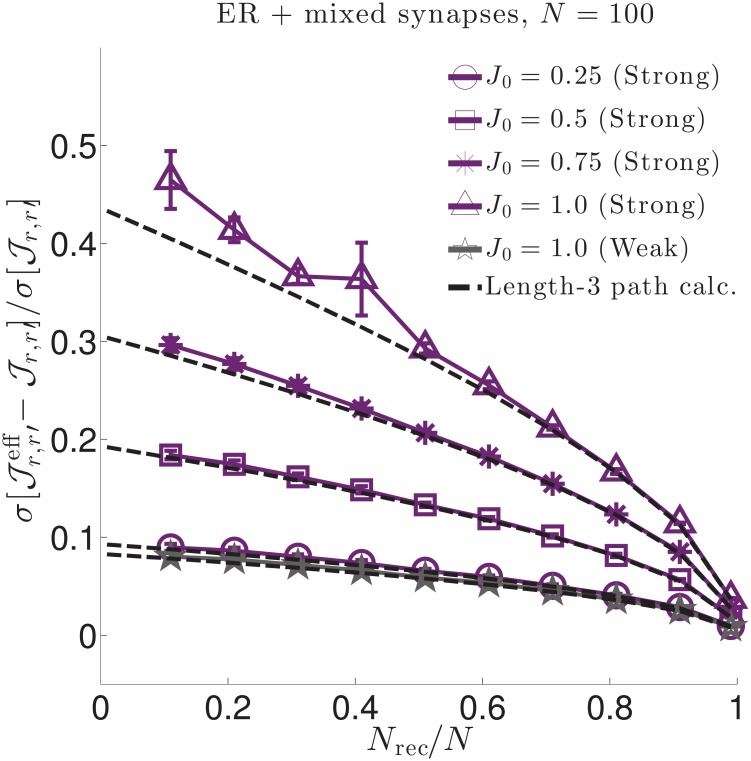
Fig 9. Same as Fig 5, but for N = 100 neurons and Nrec = {1, 11, 21, 31, 41, 51, 61, 71, 81, 91, 99} recorded neurons.
Because we plot the relative deviations of the coupling strength against the fraction of observed neurons, the curves for the strongly coupled case are the same as for N = 1000, as expected, while the weakly coupled case yields stronger deviations.

