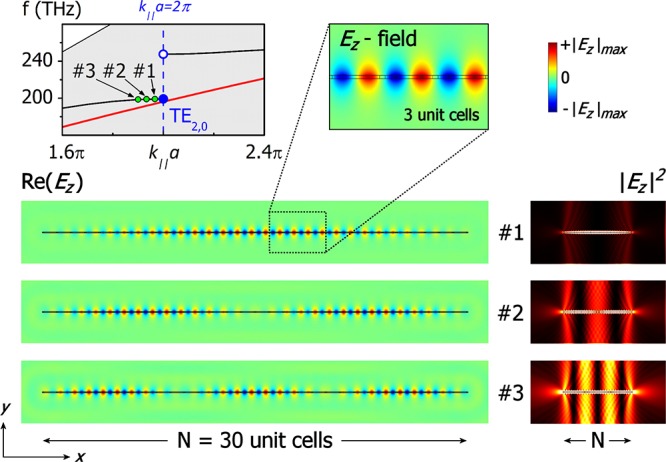
Figure 2.

Example of the discretized dispersion due to finite size, for a system with N = 30 unit cells (detail of dispersion diagram close to the 2nd bandgap). The first three discretized modes are marked with the green dots (identified with #1, #2, and #3), where the dispersion of the infinite system (interrupted black line) and of the homogeneous dielectric slab (continuous red line) are shown as well. The spatial distributions of Re(Ez) and |Ez|2 for the three modes are shown below. In the intensity plots on the right panel, a narrow range is shown from 0 (black) to ∼1.7 × 10⁻³ |Ez|2max, to emphasize the leaked over the stored energy.
