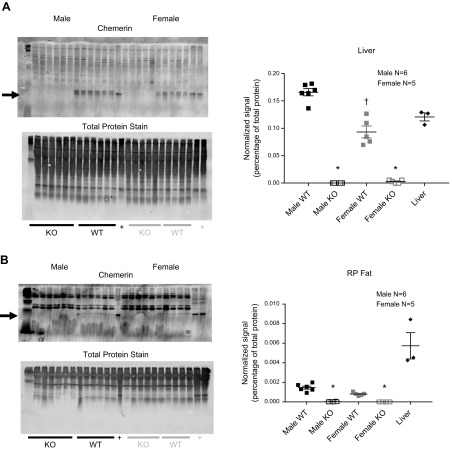
Figure 2.
Comparison of chemerin in liver (A) and RP fat (B) from male (left blots) and female (right blots) rats. Plus sign indicates normal Sprague-Dawley male (from outside of colony) liver homogenate. Arrows point to chemerin. Total protein stains on membranes were done before blocking and adding the primary antibody against chemerin. Right panels: chemerin signal was normalized to total protein for each respective lane in the graphs where horizontal bars are means ± sem for number of animals in parentheses, surrounded by scattered values. Asterisk denotes significantly different vs. same sex WT; dagger indicates comparison to different male WT, as determined by ANOVA, followed by Tukey’s post hoc test.

