Figure 2.
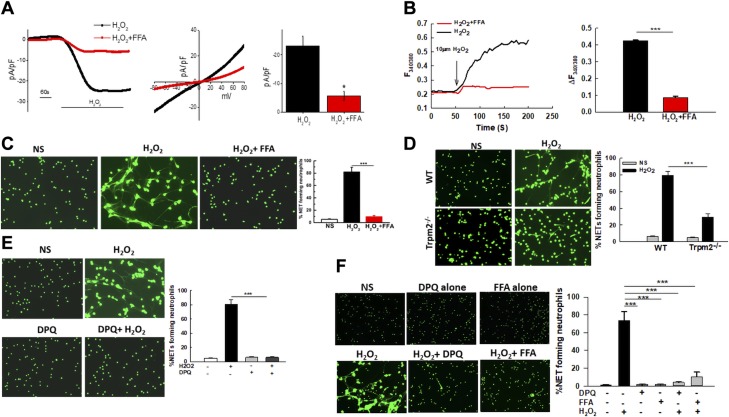
In vitro stimulation with exogenous H2O2 activates cation channel TRPM2 in neutrophils, which is required for NET formation. A) The TRPM2-like current in H2O2-stimulated primary neutrophils was measured by whole cell patch-clamp method in the presence or absence of 0.1 mM FFA. Respective current–voltage (I–V) curves and current intensity (average of 8–10 recordings represented by bar graph) at −80 mV are shown. Attenuation of current density was found with FFA-treated neutrophils. B) Ca2+ imaging was performed in 10 µM H2O2-stimulated neutrophils with and without 0.1 mM FFA. Analog plots of the fluorescence ratio (340/380) from an average of 40–60 cells are shown. Bar graph shows quantification (mean ± sd) of the fluorescence ratio (340/380) from 3 independent experiments.. C) Neutrophils were pretreated for 30 min)with 0.1 mM FFA and subsequently stimulated with 10 mM H2O2 for 4 h. NETs were stained using Sytox Green. Representative fluorescent images of NETs are shown (original magnification, ×200). Bar graph shows quantification of NETs as the average ± se of 3 independent experiments. D) Representative fluorescent images of WT and Trpm2−/− neutrophils unstimulated (NS) or stimulated with H2O2 for 4 h. NETs were fixed and stained with Sytox Green (original magnification, ×200). The bar graph shows quantification of NETs (average ± se) in WT and Trpm2−/− neutrophils. The results include data from 5 independent experiments. E) Neutrophils were pretreated for 30 min with 5 µM DPQ (PARP inhibitor) and subsequently stimulated with H2O2 for 4 h. NETs were visualized by staining with Sytox Green. Representative fluorescent images are shown (original magnification, ×200). Bar graph shows average NETs ± se of 3 independent experiments. F) Neutrophils isolated from peripheral blood of healthy adults were stimulated with H2O2 with or without a 30 min pretreatment with 5 µM DPQ or 0.1 mM FFA. NETs were stained using Sytox Green. Representative fluorescence images from 1 out of 3 individuals are shown (original magnification, ×200). The bar graph shows the quantification of NETs (average ± se) from 3 healthy adults (1 female and 2 males). *P < 0.05 (statistically significant), ***P < 0.001.

