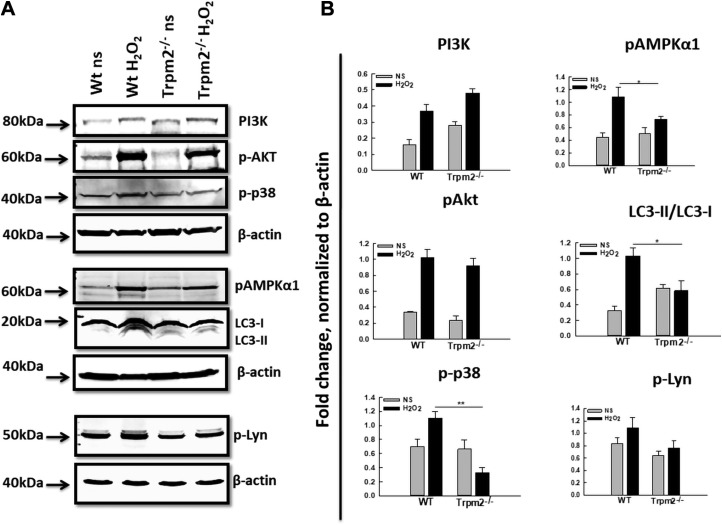
Figure 3.
Signaling pathway of TRPM2-mediated in vitro NET formation in response to H2O2 stimulation. A) Western blot analysis was performed on equal amounts of protein from cell lysates of WT and Trpm2−/− neutrophils unstimulated (NS) or stimulated with H2O2 using antibodies against various signaling proteins. The experiments were performed 3–4 times and representative blots for individual proteins are shown. B) Densitometry was performed for respective protein bands using ImageJ software. For the calculation of fold change, average pixel intensities of specific bands were normalized to the housekeeping protein β-actin. For LC3, the fold change depicts the ratio of normalized LC3-II to LC3-I. The average of data from 3 independent experiments is shown. *P < 0.05, **P < 0.01.

