Figure 4.
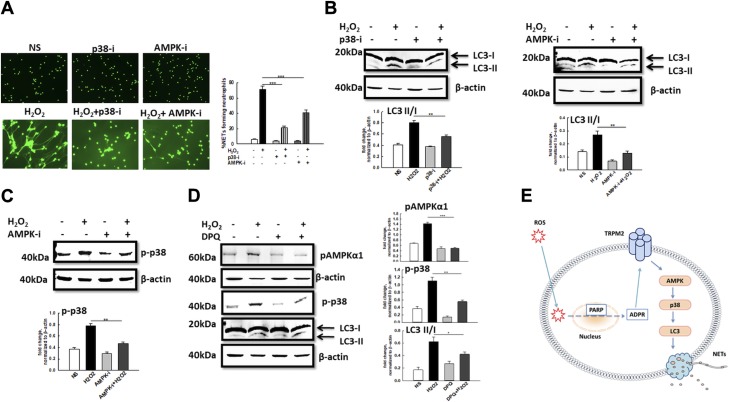
The AMPK/p38/autophagy axis regulates in vitro NET formation in response to H2O2 stimulation. Inhibition of phosphorylation of AMPK and p38 impairs NET formation. A) Representative fluorescent images of WT neutrophils pretreated for 30 min with 10 µM of phospho-p38 inhibitor SB203580 (p38-i) or 10 µM of phospho-AMPK inhibitor Compound C (AMPK-i) followed by stimulation with H2O2. NETs were visualized using Sytox Green staining. Original magnification, ×200. Bar graph shows quantification of NETs (average ± se) from 3 independent experiments. ***P < 0.001. B) Western blot analysis of autophagy activation indicated by level of LC3-II expression in WT neutrophils stimulated with 10 mM H2O2 in the presence or absence of p38-i and AMPK-i. Bar graph depicts densitometry analysis of protein bands showing the ratio of LC3-II over LC3-I after normalization of band intensities using that of β-actin. Data shown is the average of 3 to 4 independent experiments. C) Western blot analysis of phospho-p38 expression in H2O2-stimulated neutrophils in the presence or absence of AMPK-i. Bar graph depicts densitometry analysis protein band intensities normalized to β-actin. D) Western blot analysis of phospho-AMPKα1, phospho-p38, and LC3-I and -II expression in H2O2-stimulated neutrophils in the presence or absence of DPQ. Bar graph shows densitometry of specific band intensities normalized to β-actin. E) A model depicting signaling pathway of TRPM2-mediated NET formation in response to ROS.

