Figure 8.
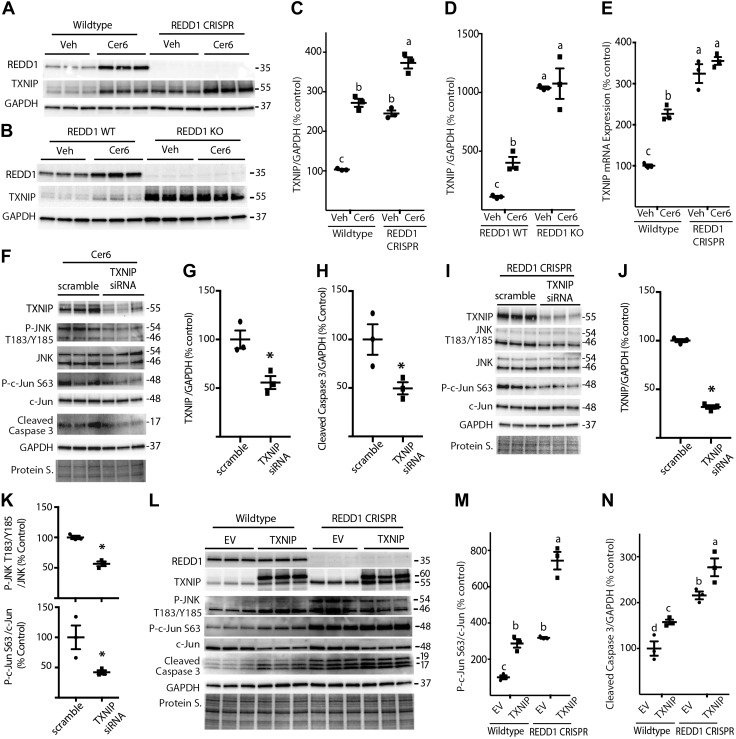
REDD1 deletion promotes JNK activity in a TXNIP-dependent manner. A) WT and REDD1 CRISPR MIO-M1 cells were treated with 1.2 μl/ml DMSO vehicle (Veh) or 60 μM C6-Cer (Cer6) for 8 h. B) WT and REDD1-knockout (KO) MEFs were treated similarly with Veh or Cer6 for 4 h. C, D) Quantification of TXNIP protein expression in R28 (C) and MEFs (D), respectively. E, F) WT and REDD1 CRISPR MIO-M1 cells (E) were treated as described in A, and TXNIP mRNA was assessed by RT-PCR (F). WT MIO-M1 cells were transfected with either scrambled RNA or TXNIP siRNA for 18 h and then treated with Cer6 for 12 h. G, H) Quantification of TXNIP (G) and cleaved caspase 3 (H) levels in F. I) REDD1 CRISPR MIO-M1 cells were transfected with scrambled RNA or TXNIP siRNA for 48 h. J, K) Quantification of TXNIP (J) and phosphorylation of JNK (Thr183/Tyr185)/c-Jun (Ser63) (K) in I. Graphs in K share x-axis labels. L) WT and REDD1 CRISPR MIO-M1 cells were transfected with myc-FLAG-TXNIP plasmid (TXNIP) or an empty vector control plasmid (EV) for 24 h. Abundance of total REDD1, TXNIP, JNK, c-Jun, cleaved caspase 3, GAPDH, and phosphorylation of JNK on Thr183/Tyr185 and c-Jun on Ser63 were assessed in whole-cell lysates by Western blot analysis. M, N) Quantification of phosphorylation of c-Jun (Ser63) (M) and cleaved caspase 3 levels (N) in K. Protein loading was assessed by protein staining (Protein S.). Blots are representative of 2–3 experiments; within each experiment, 3 independent samples were analyzed. Protein molecular mass (kDa) is indicated at the right of the blots. Results are means ± sem (n = 3). Different letters (a–c) above the scatter plots (C–E, M, N) denote significantly different results. P < 0.05, *P < 0.05 vs. scrambled RNA.

