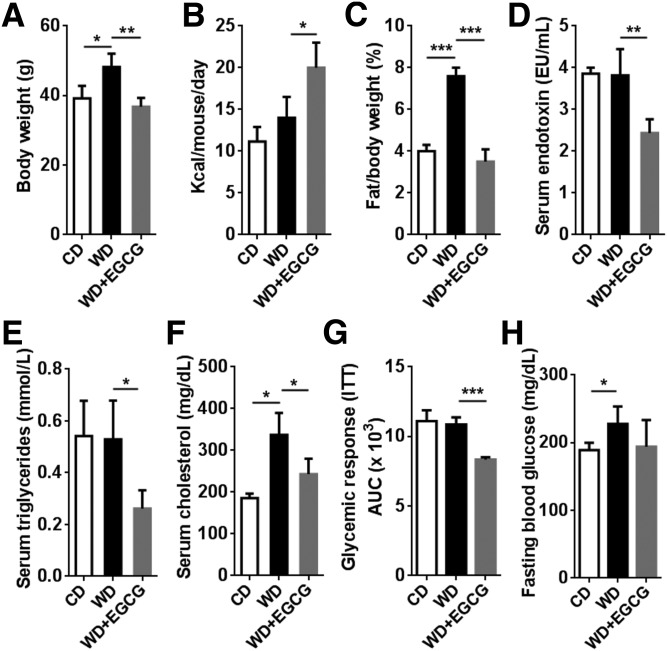
Figure 1.
Phenotypes of CD, WD, and WD+EGCG-fed mice. A–F) Body weight (A); food intake (B); visceral fat:body weight ratio (C); serum endotoxin level (D); serum triglycerides (E); and cholesterol level (F). G, H) AUC in an insulin sensitivity test (G) and fasting blood glucose level (H) (n = 3–4/group). Data are expressed as means ± sd. *P < 0.05, **P < 0.01, ***P < 0.001 (1-way ANOVA with Tukey’s correction).

