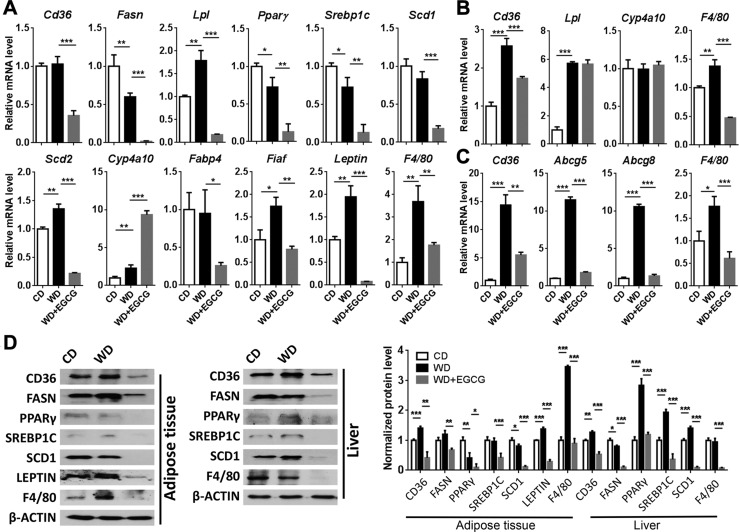
Figure 2.
A–C) The expression of fatty acid synthesis and metabolism genes in adipose tissue (A), liver (B), and ileum (C) of CD-, WD- and WD+EGCG–fed mice. D) Western blot analysis of indicated protein levels in the adipose tissue and liver. The bar graph shows the quantitative results of indicated proteins, which were normalized with corresponding β-Actin level (n = 3–4/group). Data are expressed as means ± sd. *P < 0.05, **P < 0.01, ***P < 0.001 (1-way ANOVA with Tukey’s correction).

