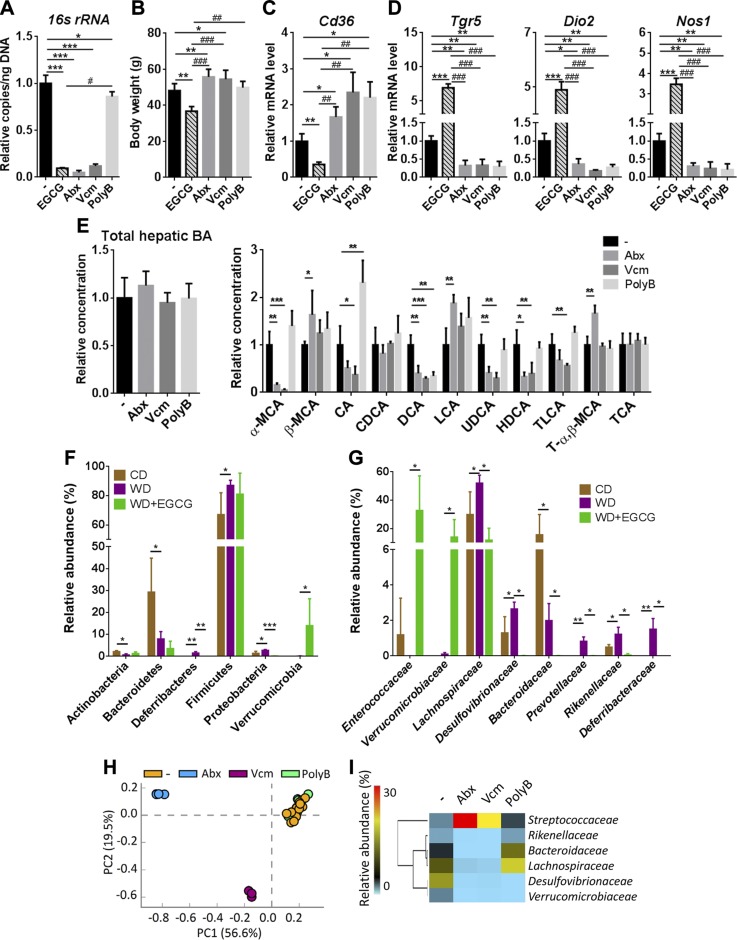
Figure 7.
The effect of EGCG and antibiotics on gut bacteria, gene expression, and hepatic BA profile in WD-fed mice. A) The antibacterial effect of EGCG and antibiotics. B) Body weight of EGCG and antibiotic-treated mice. C) Cd36 mRNA levels in the adipose tissue of EGCG and antibiotic-treated mice. D) The expression of the Tgr5 gene and TGR-5–regulated signaling genes in the liver of EGCG and antibiotic-treated mice. E) Total hepatic and individual BAs in antibiotic-treated mice. F, G) Cecal microbiota composition at the phylum level (F) and relative abundance at the family level (G) in CD- and WD-fed mice and mice without and without EGCG supplementation. Data are means ± sd. Mann-Whitney U test. H) A PCA plot of cecal microbiota at family level in antibiotic-treated mice. I) The effect of antibiotics in the abundance of bacterial families (mean relative abundance) (n = 3–4 in EGCG and antibiotic-treated groups; n = 16 for the nontreated group in the antibiotics experiment). Data are means ± sd. *P < 0.05, **P < 0.01, ***P < 0.001, vs. WD-fed untreated group; #P < 0.05, ##P < 0.01, ###P < 0.001 vs. EGCG-treated mice (2-tailed Student’s t test or 1-way ANOVA with Tukey’s correction).

