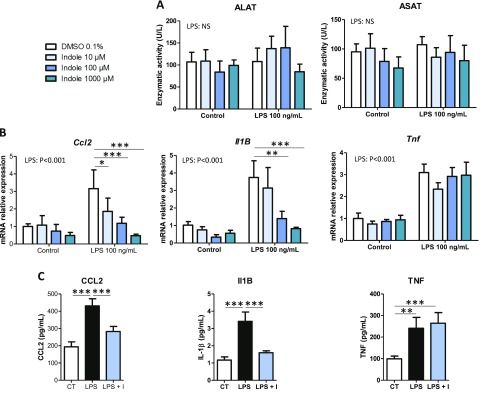
Figure 2.
Dose effects of indole on PCLS. PCLS were treated with or without LPS (100 ng/ml) and indole (10–1000 µM). A) ALAT and ASAT were measured in culture medium. B) mRNA levels were quantified in PCLS using real-time quantitative PCR. C) Cytokines were quantified in culture medium using Luminex. For this experiment, intermediate concentration of indole was used (100 µM). For IL-1B, concentration in control and LPS + indole group were extrapolated beyond standard range, but fluorescent signal was always higher than signal measured in blank. Data are presented as means ± sem, n ≥ 5 mice in each condition (experiment 1). Mixed-model ANOVA was used with LPS and indole (I) treatments as fixed effects and mouse as random effect. For pairwise comparison, mean value of each indole-treated group was compared to mean of respective vehicle group in water- or LPS-treated conditions. NS, not significant. ***P < 0.001, **P < 0.01 *P < 0.05 (adjusted by Tukey method).

