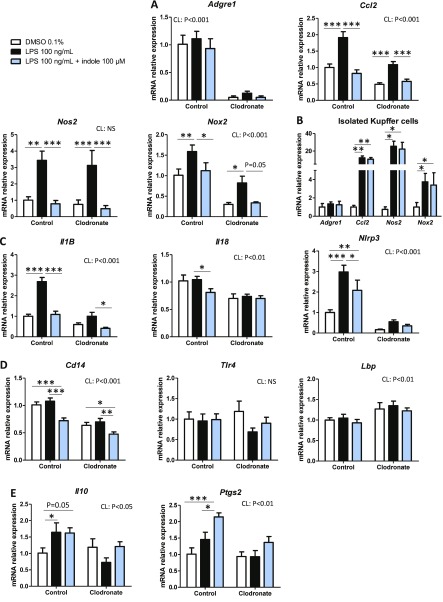
Figure 3.
Effects of indole on PCLS prepared from mice without KC. PCLS were prepared after injection of CL or NaCl (control) before treatment with or without LPS (100 ng/ml) and indole (100 µM). A, C–E) mRNA levels were quantified in PCLS using real-time quantitative PCR, n ≥ 8 mice in each condition (experiment 2). Mixed-model ANOVA was used with CL, LPS, and indole treatments as fixed effects and mouse as random effect. Mean values were compared pairwise in control or CL conditions. B) mRNA levels were quantified by real-time quantitative PCR in isolated KC treated with or without LPS (100 ng/ml) and indole (100 µM), n = 4 mice in each condition (experiment 1). Mixed-model ANOVA was used with LPS and indole treatments as fixed effects and mouse as random effect. Mean values were compared pairwise. Data are presented as means ± sem. NS, not significant. ***P < 0.001, **P < 0.01, *P < 0.05 (adjusted by Tukey method).

