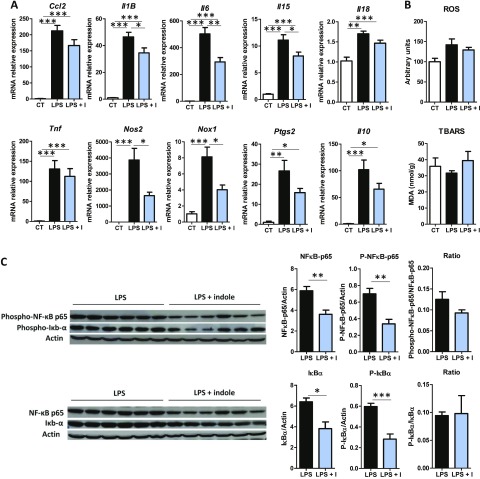
Figure 6.
Effects of indole on liver inflammation in vivo. Mice orally received water or indole (3 µmol/20 g of body weight) before intraperitoneal injection of vehicle or LPS (10 mg/kg of body weight). A) mRNA levels were quantified in liver using real-time quantitative PCR. Results are expressed relative to mRNA level measured in control group (set at 1). B) ROS and TBARS were quantified in liver. C) Left: Western blot of β-actin, and total and phosphorylated forms of NF-κB p65 and IκBα in liver lysate. right: band intensities were quantified relative to band intensity of β-actin, used as loading control. Data are presented as means ± sem, n = 6 mice in LPS and LPS + indole (LPS + I) groups, n = 4 in control group (CT) (experiment 4). ANOVA was used to test treatment effect, and mean values were compared pairwise. ***P < 0.001, **P < 0.01, *P < 0.05 (adjusted by Tukey method).

