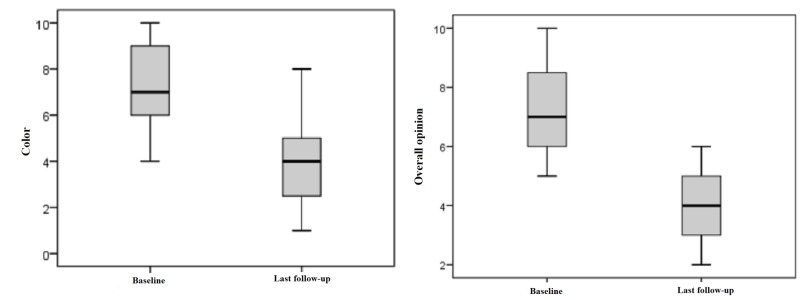
Figure 3. Patient ratings for "color" and "overall opinion" preoperatively and at last follow-up.
Patient ratings: 1 = as normal skin, 10 = very different from normal skin
Box displays lower and upper quartiles, median value is indicated by the horizontal line, endpoints of the upper and lower whisker display minimum and maximum values.

