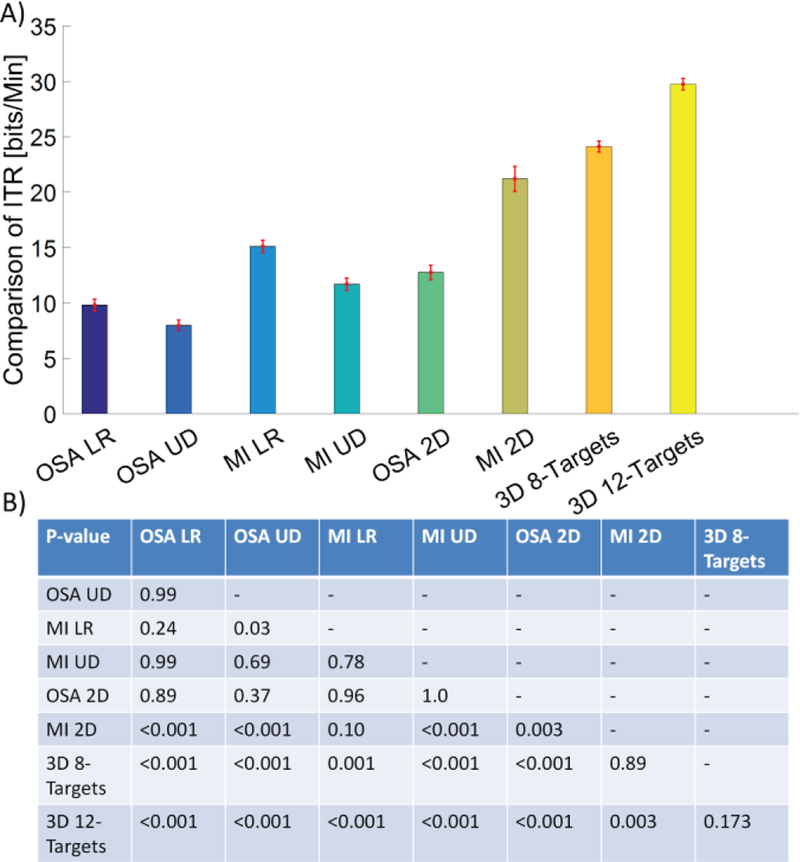
Fig. 4.

Comparison of ITR in a subset of nine subjects for all of the experimental conditions. The group average of ITR for each condition is displayed by the height of the bar with the SEM being overlaid. The p-values for statistical analysis by a linear mixed effect model are shown in the subplot at the bottom. A post hoc Tukey’s test was used to correct for multiple comparisons.
