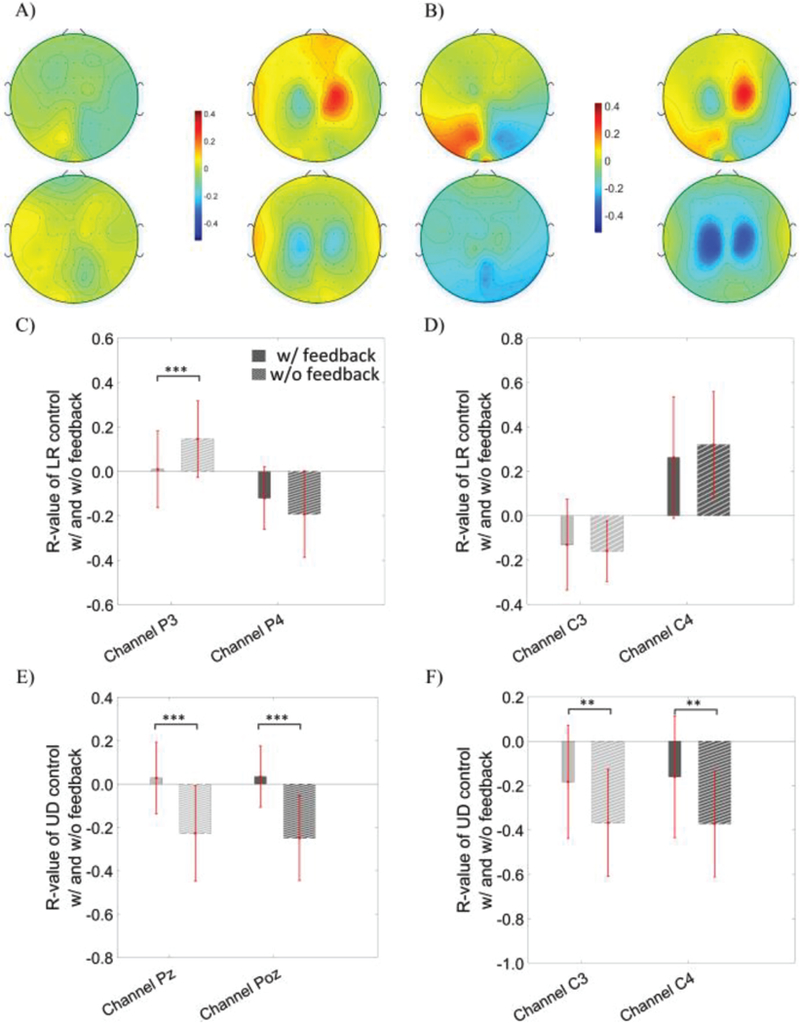
Fig. 5.

The R topography map of OSA modulation (the first column of each panel) versus MI modulation (the second column of each panel) without feedback in subfigure (A) and with feedback in subfigure (B). R values were calculated using all trials. The first row of each subfigure displays the R topography of the left versus right control task; the second row of each subfigure shows the R topography for the up versus down control task. C) The statistical comparison of R-values at the P3 and P4 electrodes during left versus right control via OSA modulation, D) at the C3 and C4 electrodes during left versus right control via MI modulation, E) at the Pz and Poz electrodes during up versus down control via OSA, and F) at the C3 and C4 electrodes during the up versus down control via MI modulation.
