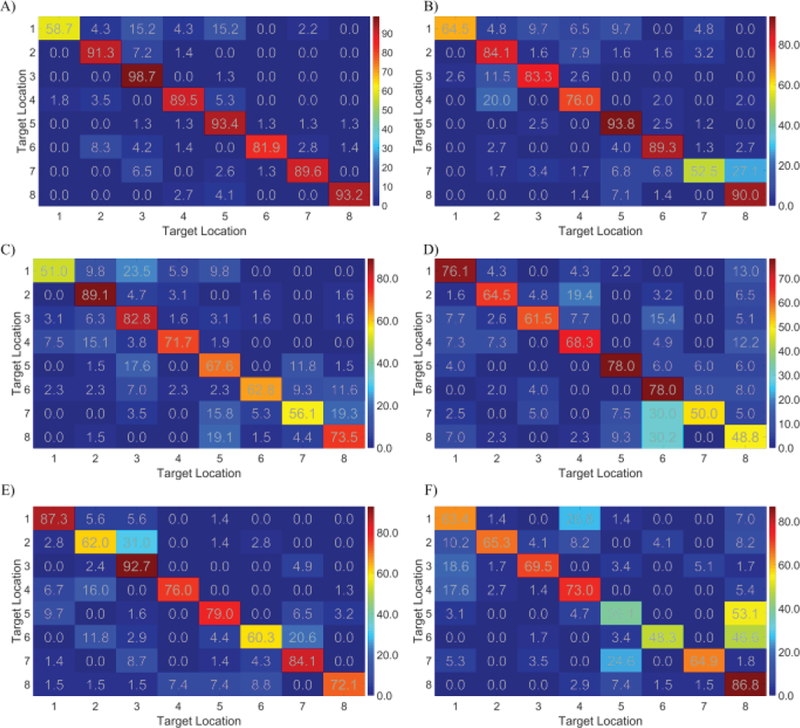
Fig. 8.

Individual confusion matrices (color bar unit: percentage) for the 3D control tasks. A)–D) Four examples of individual confusion matrices among the 11 subjects who use the strategies in the figure 7B. E)–F) Two examples of individual confusion matrices among the 5 subjects who use the strategies in the figure 7A.
