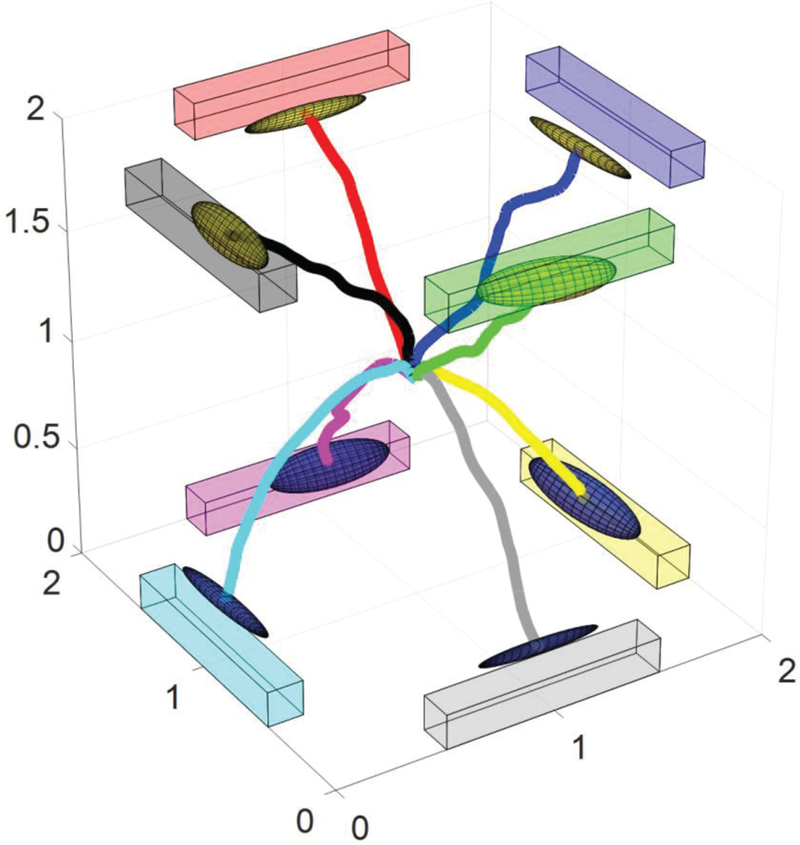
Fig. 9.

Average cursor movement trajectories for a particular subject. The virtual cubic workspace was rotated for easier visualization of all of the trajectories. The colored bars show the targets in the workspace and the ellipsoids display the estimated distribution of the end points of cursor during all of the hit trials. The movement path was derived by averaging all of the hit trials.
