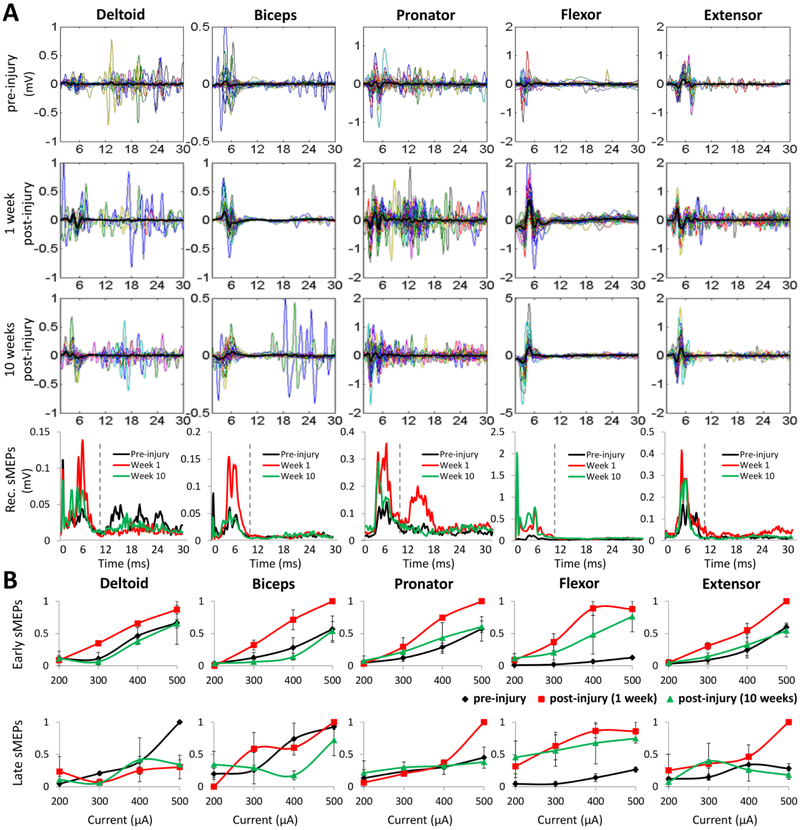
Figure 5: Changes in spinal excitability after SCI.
(A) Examples of sMEPs evoked in each forelimb muscle during C6− C8+ stimulation (400 μA current intensity) of the same rats preinjury and at 1 and 10 weeks post-injury. Each panel shows 30 superimposed sMEPs (different colors) with the mean shown in black. sMEPs were rectified (Rec.) and the means for each time point for each muscle are shown in the bottom row. The vertical dashed lines in the bottom row separate the early (<10 ms) and late (10-30 ms) sMEP responses. (B) Changes in the mean (±SEM) sMEP magnitudes normalized to the maximum value (area under the rectified curve) of the early and late responses for each muscle pre-injury (black trace) and at 1 (red trace) and 10 (green trace) weeks post-injury are shown as a function of increasing stimulation current intensities.

