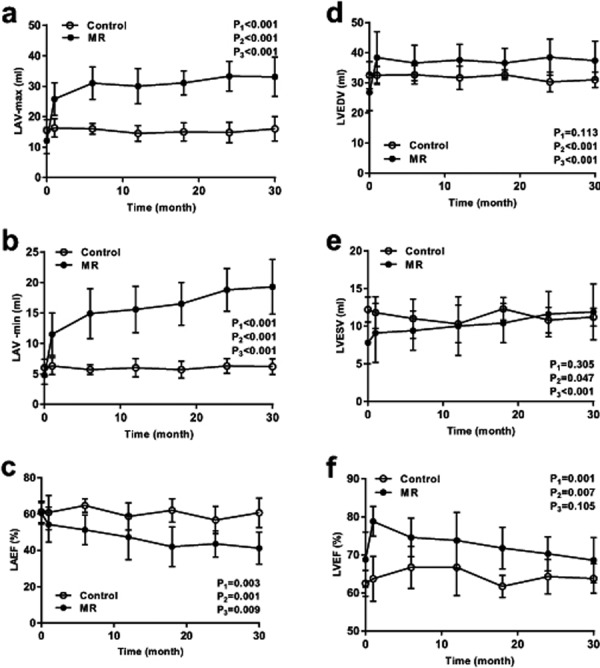
Fig. 4.

Volume and systolic function of the left atrium and left ventricle. Comparison of LAV max (a), LAV min (b), LAEF (c), LVEDV (d), LVESV (e) and LVEF (f) between the experimental group and the control group. P1: P value of intergroup comparison, P2: P value of intragroup comparison, P3: P value of interaction effect.
