Fig. 5.

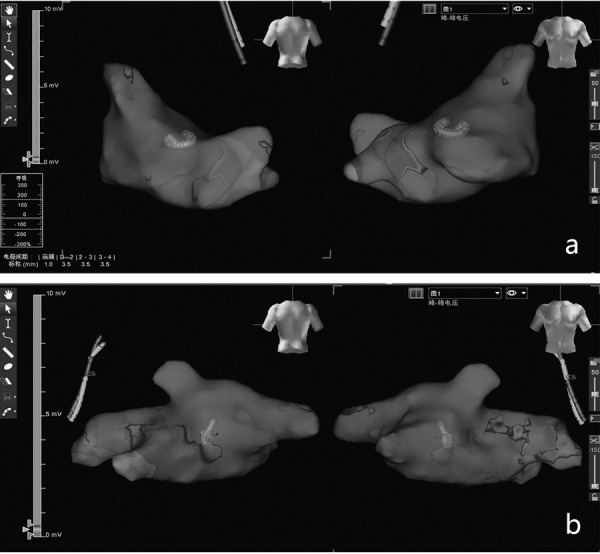
The voltage map in the mitral regurgitation group and the normal group. Three-dimensional mapping showing no low-voltage zones in the left atrium of the control group (a) or the mitral regurgitation group (b).

The voltage map in the mitral regurgitation group and the normal group. Three-dimensional mapping showing no low-voltage zones in the left atrium of the control group (a) or the mitral regurgitation group (b).