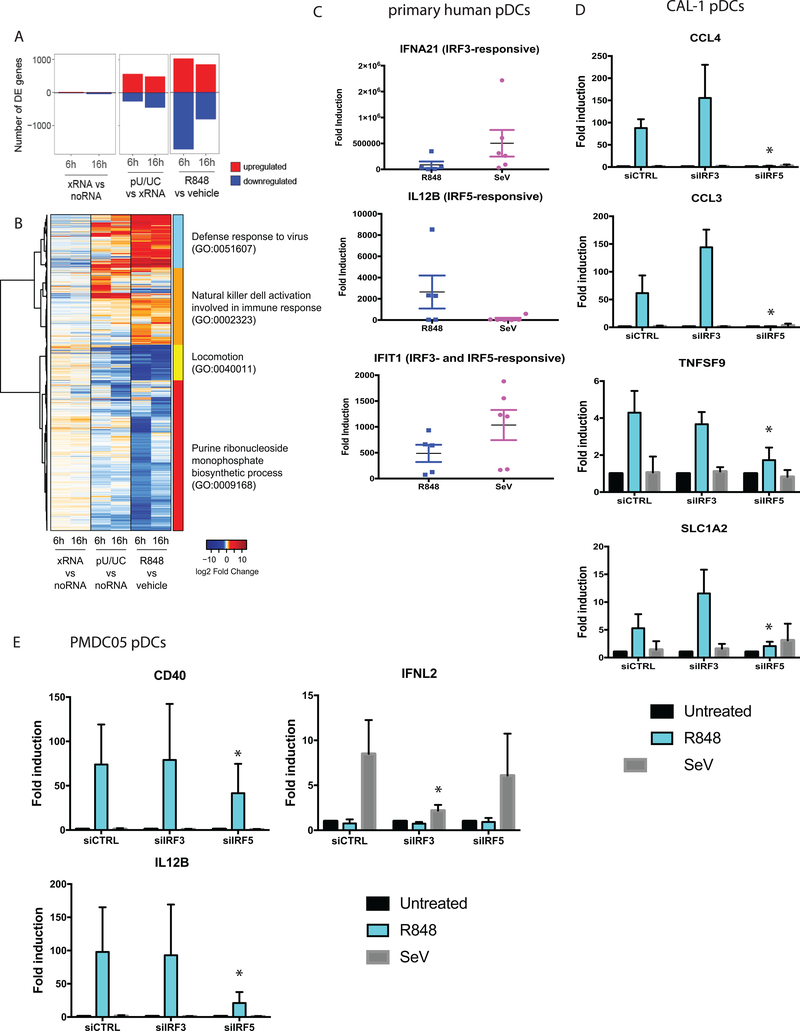
Figure 4. RLR/IRF3 and TLR7/IRF5 partitioning regulate different sets of genes in pDCs.
(a) RNAseq analysis of CAL-1 cells treated with vehicle or 1ug/ml R848, or transfected with xRNA (control) or poly-U/UC RNA. Number of differentially expressed (DE) genes (Fold change > 2, p-value < 0.05) upregulated (red) or downregulated (blue) at 6 and 16 hour time points compared to control samples are shown. (b) Heatmap showing gene expression profiles of all genes that are DE in at least one comparison (R848/vehicle-6hrs, R848/vehicle-16hrs, pU/UC/xRNA-6hrs, and pU/UC/xRNA-16hrs), visualized by log2 fold change over control sample. (c) Quantitative real-time PCR of indicated genes in primary human donor pDCs treated with 1ug/ml R848 for 6 hours, or infected with SeV (100HAU/ml) for 9 hours. Data represent results from 6 individual donors. (d) Quantitative real-time PCR of indicated genes in CAL-1 pDCs transfected with siRNAs against IRF3 or IRF5, followed by treatment with 1ug/ml R848 for 6 hours, or infection with SeV (100HAU/ml) for 9 hours. Data represent results from biological triplicates. (e) Quantitative real-time PCR of indicated genes in PMDC05 pDCs transfected with siRNAs against IRF3 or IRF5, followed by treatment with 1ug/ml R848 for 6 hours, or infection with SeV (100HAU/ml) for 9 hours. RNAseq experiment was performed once with biological triplicates. Experiments with primary pDCs and pDC cell lines (c-e) were performed 4 times; quantitative real-time PCR data represent results from 4 biological replicates. *p<0.05.

