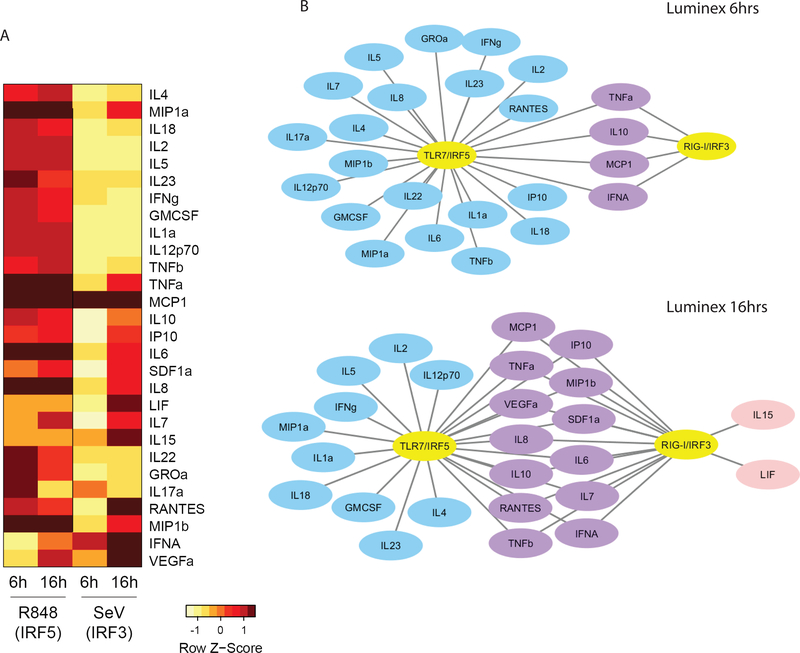
Figure 7. Differential cytokine and chemokine production by IRF3 and IRF5.
(a) Luminex analysis of CAL-1 cells treated with 1ug/ml R848 or infected with 100HAU/ml SeV for 6 or 16 hours. Fold change over untreated/mock-infected cells were calculated for each analyte, and those with fold change above 2 are displayed in the heap map. Log2 of fold change (log2(treatment) -log2 (baseline)) for each analyte was calculated and values were row-normalized and displayed as z-scores. (b) Luminex analysis in (a) displayed as networks showing 6 and 16 hour time points. Blue denotes factors only induced with R848 treatment, pink denotes factors only induced with SeV infection, purple denotes factors induced by both treatments. Luminex experiment was performed once with biological triplicates analyzed in technical duplicates.

