
Figure 3. CENP-A deposition proteins accumulate at centromeres during DNA replication in response to MG132 treatment.
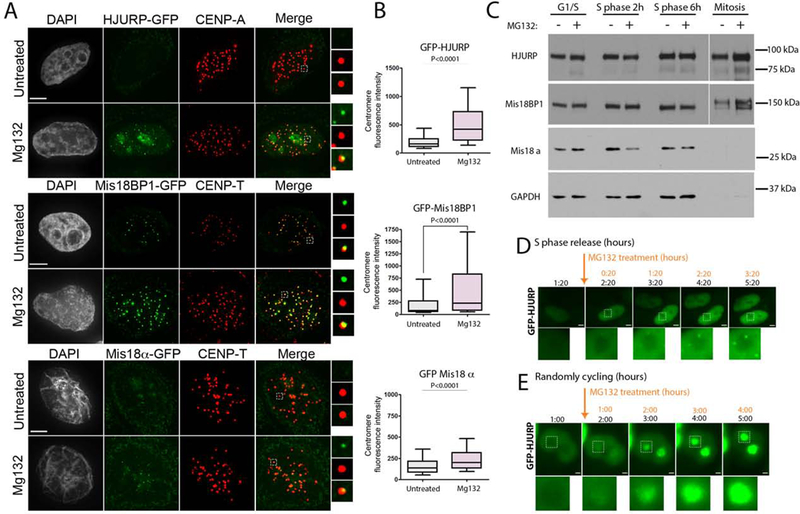
(A) Representative images of cells expressing GFP-fused HJURP, Mis18BP1 or Mis18α during S phase with or without MG132 treatment. Scale bar is 5μm. (B) Quantification of the GFP fluorescence intensity in A. Data was plotted using box-and-whisker plot: 10–90 percentile. The statistical significance was calculated using unpaired t-test and the p values are indicated, n > 434 (C) Immunoblot analysis of HJURP, Mis18BP1 and Mis18α protein levels in response to MG132 treatment at indicated cell cycle stages. The separated section of the blot corresponds to a longer exposure required due to unequal loading (see GAPDH). (D)(E) Live-cell images of cells expressing GFP-HJURP undergoing S phase. (D) or in asynchronous (E) cell populations. Cells were treated with MG132 during imaging starting from the time points indicated by the arrow. Scale bar is 5μm and 2μm, respectively.