
Figure 5. HJURP is required for CENPA inheritance of existing CENP-A nucleosomes.
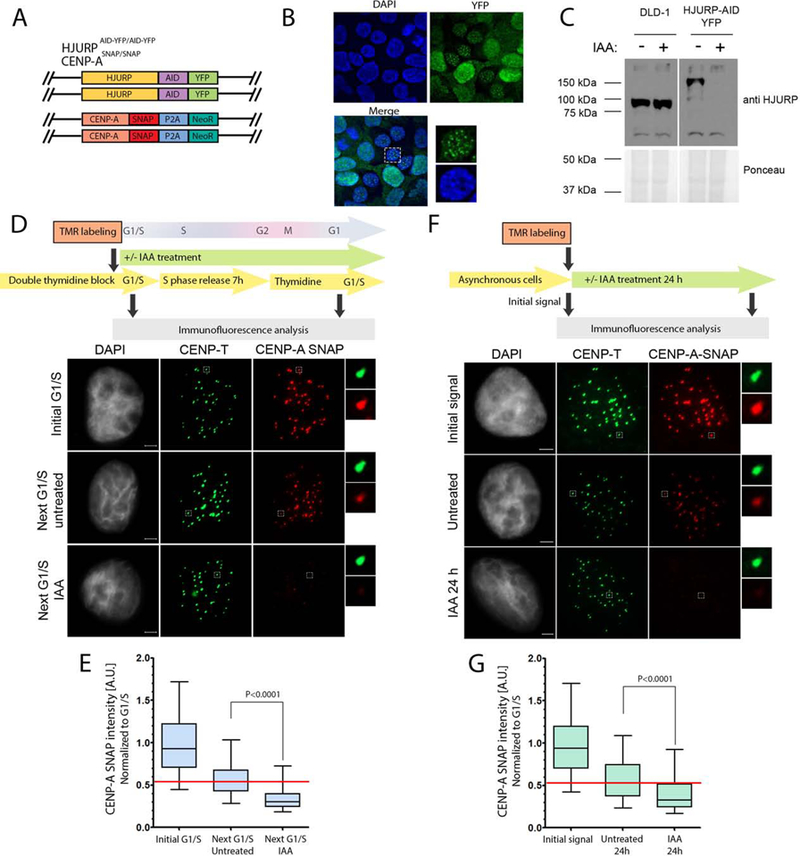
(A) Schematic representation of the DLD1-Tir1 cell line where HJURP was endogenously tagged with AID-YFP and CENP-A was endogenously tagged with the SNAP tag. (B) The immunofluorescence images of the localization profile of HJURP-AID-YFP in cell line shown in A. (C) Immunoblot analysis of the efficiency of IAA dependent HJURP degradation during mitosis demonstrated by staining with HJURP antibody. Ponceau staining was used as a loading control. The blots were separated in two sections due to removal of empty lanes from the original blot. (D) (F) Schematic representation of the experiment (top). Representative images of cells at indicated time points and treated as shown in the top panel. DNA was visualized by DAPI, immunofluorescence for CENP-T is shown in green and CENP-A is shown in red (bottom). Scale bar is 2μm. (E)(G) Quantification of D and F, respectively. The data was normalized to initial G1/S condition (E) or initial signal (G) within each individual experiment. Normalized data from two (E) or three (G) independent experiments was plotted using box-and-whisker plot: 5–95 percentile, n at least 4674 (E) and 2295 (G). The statistical significance was calculated using unpaired t-test and the p values are indicated. For reference, red line indicates the median level of CENP-A retention in untreated control. The percent loss of CENP-A was calculated to be 38.41% and 27.91% in E and G, respectively.